
- PREMIUM
- LIVE QUOTES
- INSTITUTIONS
 Index Options
 State Street
 CME Group
 Nasdaq
 Cboe
Cboe TradingView
 Wall Street Journal
Is Fortis Healthcare (NSE:FORTIS) Using Too Much Debt?
David Iben put it well when he said, 'Volatility is not a risk we care about. What we care about is avoiding the permanent loss of capital.' So it seems the smart money knows that debt - which is usually involved in bankruptcies - is a very important factor, when you assess how risky a company is. We note that Fortis Healthcare Limited (NSE:FORTIS) does have debt on its balance sheet. But the more important question is: how much risk is that debt creating?
What Risk Does Debt Bring?
Debt assists a business until the business has trouble paying it off, either with new capital or with free cash flow. If things get really bad, the lenders can take control of the business. However, a more frequent (but still costly) occurrence is where a company must issue shares at bargain-basement prices, permanently diluting shareholders, just to shore up its balance sheet. By replacing dilution, though, debt can be an extremely good tool for businesses that need capital to invest in growth at high rates of return. When we think about a company's use of debt, we first look at cash and debt together.
How Much Debt Does Fortis Healthcare Carry?
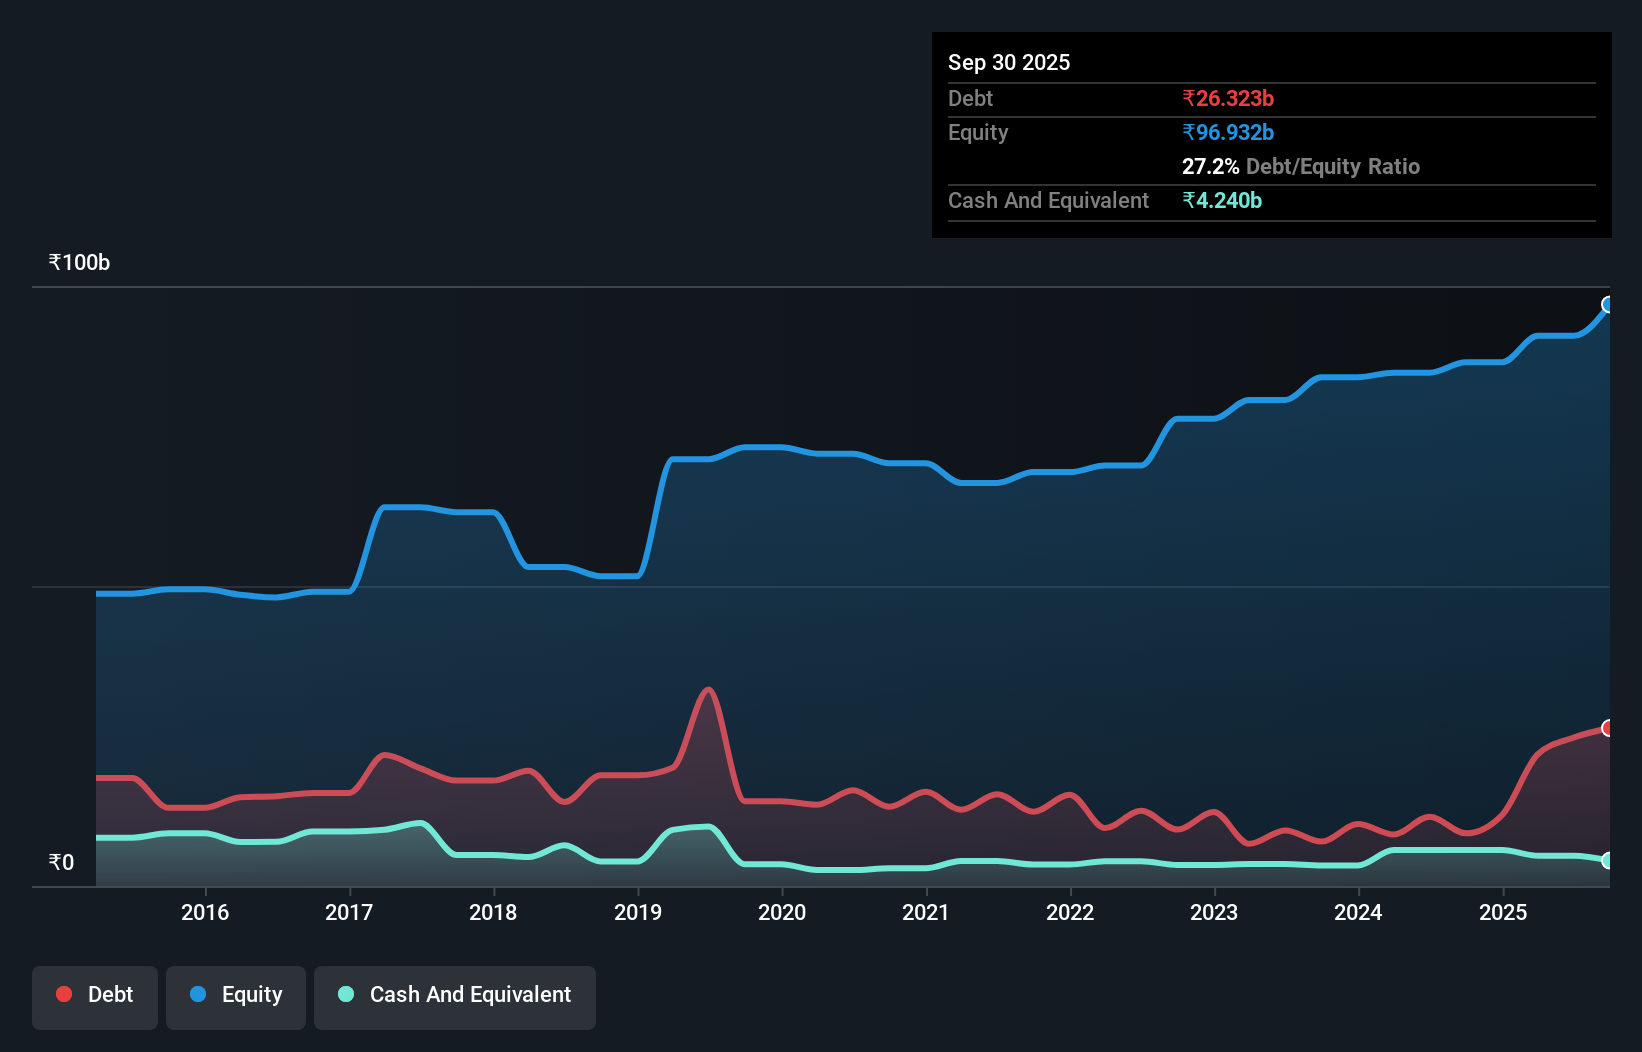
As you can see below, at the end of September 2025, Fortis Healthcare had ₹26.3b of debt, up from ₹8.77b a year ago. Click the image for more detail. However, because it has a cash reserve of ₹4.24b, its net debt is less, at about ₹22.1b.
A Look At Fortis Healthcare's Liabilities
According to the last reported balance sheet, Fortis Healthcare had liabilities of ₹17.2b due within 12 months, and liabilities of ₹36.0b due beyond 12 months. Offsetting this, it had ₹4.24b in cash and ₹10.2b in receivables that were due within 12 months. So its liabilities total ₹38.8b more than the combination of its cash and short-term receivables.
Given Fortis Healthcare has a market capitalization of ₹667.4b, it's hard to believe these liabilities pose much threat. However, we do think it is worth keeping an eye on its balance sheet strength, as it may change over time.
View our latest analysis for Fortis Healthcare
We measure a company's debt load relative to its earnings power by looking at its net debt divided by its earnings before interest, tax, depreciation, and amortization (EBITDA) and by calculating how easily its earnings before interest and tax (EBIT) cover its interest expense (interest cover). This way, we consider both the absolute quantum of the debt, as well as the interest rates paid on it.
With net debt sitting at just 1.2 times EBITDA, Fortis Healthcare is arguably pretty conservatively geared. And this view is supported by the solid interest coverage, with EBIT coming in at 9.3 times the interest expense over the last year. In addition to that, we're happy to report that Fortis Healthcare has boosted its EBIT by 35%, thus reducing the spectre of future debt repayments. There's no doubt that we learn most about debt from the balance sheet. But ultimately the future profitability of the business will decide if Fortis Healthcare can strengthen its balance sheet over time. So if you're focused on the future you can check out this free report showing analyst profit forecasts.
Finally, while the tax-man may adore accounting profits, lenders only accept cold hard cash. So we always check how much of that EBIT is translated into free cash flow. In the last three years, Fortis Healthcare's free cash flow amounted to 34% of its EBIT, less than we'd expect. That weak cash conversion makes it more difficult to handle indebtedness.
Our View
Happily, Fortis Healthcare's impressive EBIT growth rate implies it has the upper hand on its debt. But truth be told we feel its conversion of EBIT to free cash flow does undermine this impression a bit. It's also worth noting that Fortis Healthcare is in the Healthcare industry, which is often considered to be quite defensive. Looking at the bigger picture, we think Fortis Healthcare's use of debt seems quite reasonable and we're not concerned about it. While debt does bring risk, when used wisely it can also bring a higher return on equity. Over time, share prices tend to follow earnings per share, so if you're interested in Fortis Healthcare, you may well want to click here to check an interactive graph of its earnings per share history.
If, after all that, you're more interested in a fast growing company with a rock-solid balance sheet, then check out our list of net cash growth stocks without delay.
Have feedback on this article? Concerned about the content? Get in touch with us directly. Alternatively, email editorial-team (at) simplywallst.com.
This article by Simply Wall St is general in nature. We provide commentary based on historical data and analyst forecasts only using an unbiased methodology and our articles are not intended to be financial advice. It does not constitute a recommendation to buy or sell any stock, and does not take account of your objectives, or your financial situation. We aim to bring you long-term focused analysis driven by fundamental data. Note that our analysis may not factor in the latest price-sensitive company announcements or qualitative material. Simply Wall St has no position in any stocks mentioned.