
- PREMIUM
- LIVE QUOTES
- INSTITUTIONS
 Index Options
 State Street
 CME Group
 Nasdaq
 Cboe
Cboe TradingView
 Wall Street Journal
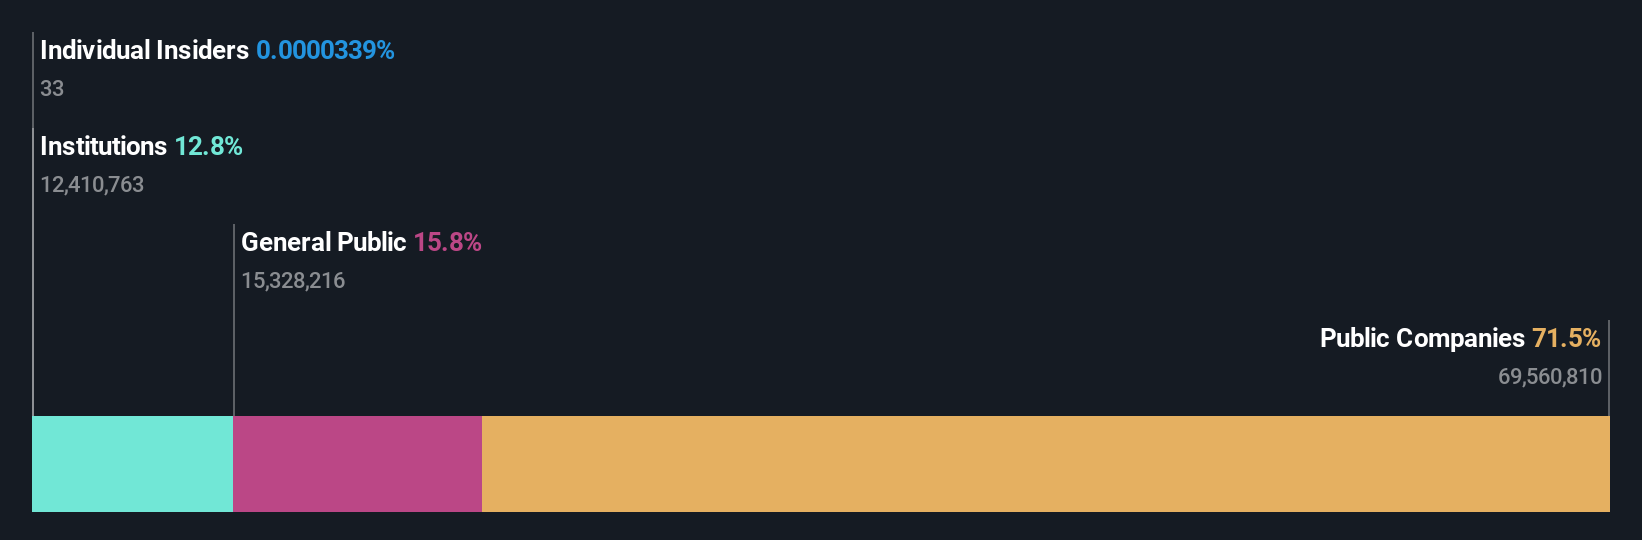
While individual investors own 16% of Sartorius Stedim Biotech S.A. (EPA:DIM), public companies are its largest shareholders with 71% ownership
Key Insights
- Sartorius Stedim Biotech's significant public companies ownership suggests that the key decisions are influenced by shareholders from the larger public
- Sartorius Aktiengesellschaft owns 71% of the company
- Institutions own 13% of Sartorius Stedim Biotech
To get a sense of who is truly in control of Sartorius Stedim Biotech S.A. (EPA:DIM), it is important to understand the ownership structure of the business. And the group that holds the biggest piece of the pie are public companies with 71% ownership. Put another way, the group faces the maximum upside potential (or downside risk).
Individual investors, on the other hand, account for 16% of the company's stockholders.
Let's delve deeper into each type of owner of Sartorius Stedim Biotech, beginning with the chart below.
Check out our latest analysis for Sartorius Stedim Biotech
What Does The Institutional Ownership Tell Us About Sartorius Stedim Biotech?
Institutions typically measure themselves against a benchmark when reporting to their own investors, so they often become more enthusiastic about a stock once it's included in a major index. We would expect most companies to have some institutions on the register, especially if they are growing.
Sartorius Stedim Biotech already has institutions on the share registry. Indeed, they own a respectable stake in the company. This suggests some credibility amongst professional investors. But we can't rely on that fact alone since institutions make bad investments sometimes, just like everyone does. It is not uncommon to see a big share price drop if two large institutional investors try to sell out of a stock at the same time. So it is worth checking the past earnings trajectory of Sartorius Stedim Biotech, (below). Of course, keep in mind that there are other factors to consider, too.

We note that hedge funds don't have a meaningful investment in Sartorius Stedim Biotech. The company's largest shareholder is Sartorius Aktiengesellschaft, with ownership of 71%. This implies that they have majority interest control of the future of the company. In comparison, the second and third largest shareholders hold about 1.2% and 1.2% of the stock.
Researching institutional ownership is a good way to gauge and filter a stock's expected performance. The same can be achieved by studying analyst sentiments. Quite a few analysts cover the stock, so you could look into forecast growth quite easily.
Insider Ownership Of Sartorius Stedim Biotech
The definition of company insiders can be subjective and does vary between jurisdictions. Our data reflects individual insiders, capturing board members at the very least. The company management answer to the board and the latter should represent the interests of shareholders. Notably, sometimes top-level managers are on the board themselves.
Insider ownership is positive when it signals leadership are thinking like the true owners of the company. However, high insider ownership can also give immense power to a small group within the company. This can be negative in some circumstances.
Our data suggests that insiders own under 1% of Sartorius Stedim Biotech S.A. in their own names. It is a very large company, so it would be surprising to see insiders own a large proportion of the company. Though their holding amounts to less than 1%, we can see that board members collectively own €6.9k worth of shares (at current prices). It is always good to see at least some insider ownership, but it might be worth checking if those insiders have been selling.
General Public Ownership
The general public, who are usually individual investors, hold a 16% stake in Sartorius Stedim Biotech. While this group can't necessarily call the shots, it can certainly have a real influence on how the company is run.
Public Company Ownership
Public companies currently own 71% of Sartorius Stedim Biotech stock. This may be a strategic interest and the two companies may have related business interests. It could be that they have de-merged. This holding is probably worth investigating further.
Next Steps:
While it is well worth considering the different groups that own a company, there are other factors that are even more important. Take risks for example - Sartorius Stedim Biotech has 1 warning sign we think you should be aware of.
But ultimately it is the future, not the past, that will determine how well the owners of this business will do. Therefore we think it advisable to take a look at this free report showing whether analysts are predicting a brighter future.
NB: Figures in this article are calculated using data from the last twelve months, which refer to the 12-month period ending on the last date of the month the financial statement is dated. This may not be consistent with full year annual report figures.
Have feedback on this article? Concerned about the content? Get in touch with us directly. Alternatively, email editorial-team (at) simplywallst.com.
This article by Simply Wall St is general in nature. We provide commentary based on historical data and analyst forecasts only using an unbiased methodology and our articles are not intended to be financial advice. It does not constitute a recommendation to buy or sell any stock, and does not take account of your objectives, or your financial situation. We aim to bring you long-term focused analysis driven by fundamental data. Note that our analysis may not factor in the latest price-sensitive company announcements or qualitative material. Simply Wall St has no position in any stocks mentioned.