
- PREMIUM
- LIVE QUOTES
- INSTITUTIONS
 Index Options
 State Street
 CME Group
 Nasdaq
 Cboe
Cboe TradingView
 Wall Street Journal
Power Assets Holdings Limited's (HKG:6) biggest owners are individual investors who got richer after stock soared 3.1% last week
Key Insights
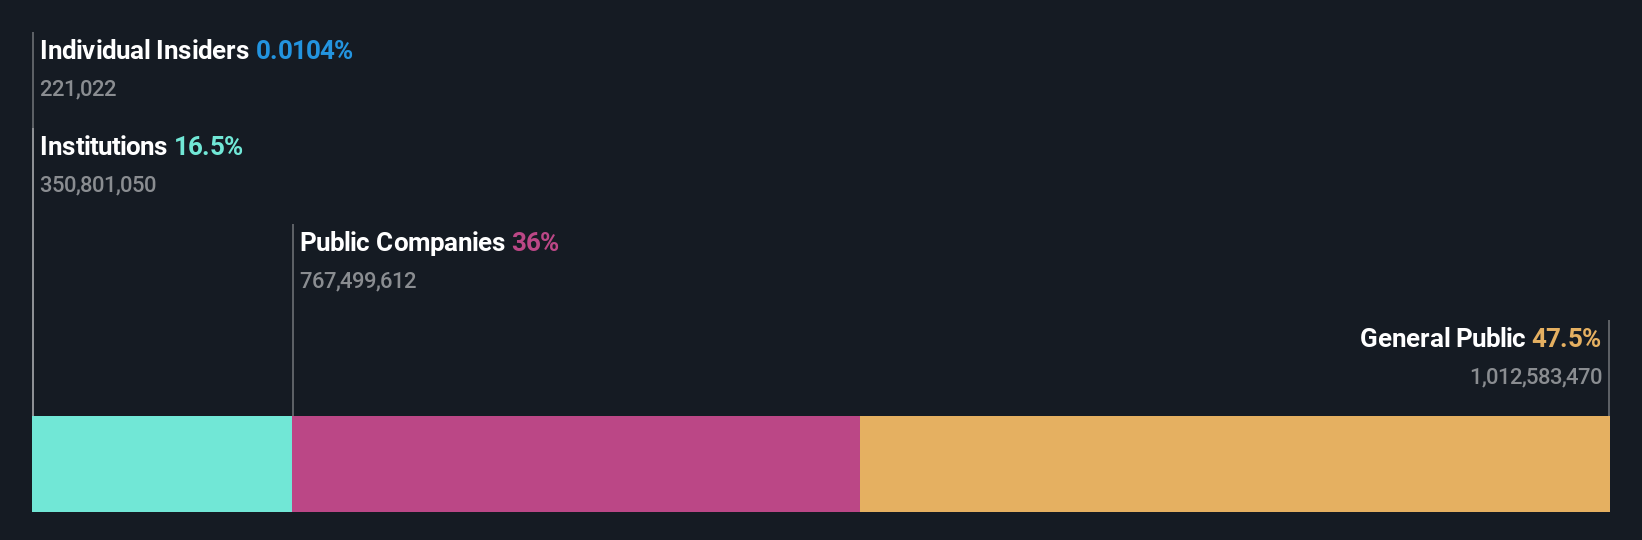
- Power Assets Holdings' significant individual investors ownership suggests that the key decisions are influenced by shareholders from the larger public
- The top 18 shareholders own 50% of the company
- Institutions own 16% of Power Assets Holdings
A look at the shareholders of Power Assets Holdings Limited (HKG:6) can tell us which group is most powerful. We can see that individual investors own the lion's share in the company with 48% ownership. In other words, the group stands to gain the most (or lose the most) from their investment into the company.
As a result, individual investors were the biggest beneficiaries of last week’s 3.1% gain.
Let's delve deeper into each type of owner of Power Assets Holdings, beginning with the chart below.
View our latest analysis for Power Assets Holdings
What Does The Institutional Ownership Tell Us About Power Assets Holdings?
Institutions typically measure themselves against a benchmark when reporting to their own investors, so they often become more enthusiastic about a stock once it's included in a major index. We would expect most companies to have some institutions on the register, especially if they are growing.
Power Assets Holdings already has institutions on the share registry. Indeed, they own a respectable stake in the company. This can indicate that the company has a certain degree of credibility in the investment community. However, it is best to be wary of relying on the supposed validation that comes with institutional investors. They too, get it wrong sometimes. If multiple institutions change their view on a stock at the same time, you could see the share price drop fast. It's therefore worth looking at Power Assets Holdings' earnings history below. Of course, the future is what really matters.

We note that hedge funds don't have a meaningful investment in Power Assets Holdings. CK Hutchison Holdings Limited is currently the company's largest shareholder with 36% of shares outstanding. With 3.0% and 2.9% of the shares outstanding respectively, Lazard Asset Management LLC and BlackRock, Inc. are the second and third largest shareholders.
Looking at the shareholder registry, we can see that 50% of the ownership is controlled by the top 18 shareholders, meaning that no single shareholder has a majority interest in the ownership.
While studying institutional ownership for a company can add value to your research, it is also a good practice to research analyst recommendations to get a deeper understand of a stock's expected performance. There are a reasonable number of analysts covering the stock, so it might be useful to find out their aggregate view on the future.
Insider Ownership Of Power Assets Holdings
The definition of company insiders can be subjective and does vary between jurisdictions. Our data reflects individual insiders, capturing board members at the very least. Management ultimately answers to the board. However, it is not uncommon for managers to be executive board members, especially if they are a founder or the CEO.
Insider ownership is positive when it signals leadership are thinking like the true owners of the company. However, high insider ownership can also give immense power to a small group within the company. This can be negative in some circumstances.
Our information suggests that Power Assets Holdings Limited insiders own under 1% of the company. As it is a large company, we'd only expect insiders to own a small percentage of it. But it's worth noting that they own HK$12m worth of shares. It is good to see board members owning shares, but it might be worth checking if those insiders have been buying.
General Public Ownership
The general public, who are usually individual investors, hold a 48% stake in Power Assets Holdings. While this group can't necessarily call the shots, it can certainly have a real influence on how the company is run.
Public Company Ownership
It appears to us that public companies own 36% of Power Assets Holdings. It's hard to say for sure but this suggests they have entwined business interests. This might be a strategic stake, so it's worth watching this space for changes in ownership.
Next Steps:
While it is well worth considering the different groups that own a company, there are other factors that are even more important. For example, we've discovered 1 warning sign for Power Assets Holdings that you should be aware of before investing here.
If you would prefer discover what analysts are predicting in terms of future growth, do not miss this free report on analyst forecasts.
NB: Figures in this article are calculated using data from the last twelve months, which refer to the 12-month period ending on the last date of the month the financial statement is dated. This may not be consistent with full year annual report figures.
Have feedback on this article? Concerned about the content? Get in touch with us directly. Alternatively, email editorial-team (at) simplywallst.com.
This article by Simply Wall St is general in nature. We provide commentary based on historical data and analyst forecasts only using an unbiased methodology and our articles are not intended to be financial advice. It does not constitute a recommendation to buy or sell any stock, and does not take account of your objectives, or your financial situation. We aim to bring you long-term focused analysis driven by fundamental data. Note that our analysis may not factor in the latest price-sensitive company announcements or qualitative material. Simply Wall St has no position in any stocks mentioned.