
- PREMIUM
- LIVE QUOTES
- INSTITUTIONS
 Index Options
 State Street
 CME Group
 Nasdaq
 Cboe
Cboe TradingView
 Wall Street Journal
Assessing Amentum Holdings After 51% Rally and New Government Contracts in 2025
- If you are wondering whether Amentum Holdings is still a smart place to put fresh money to work, you are not alone, and this article is going to tackle that value question head on.
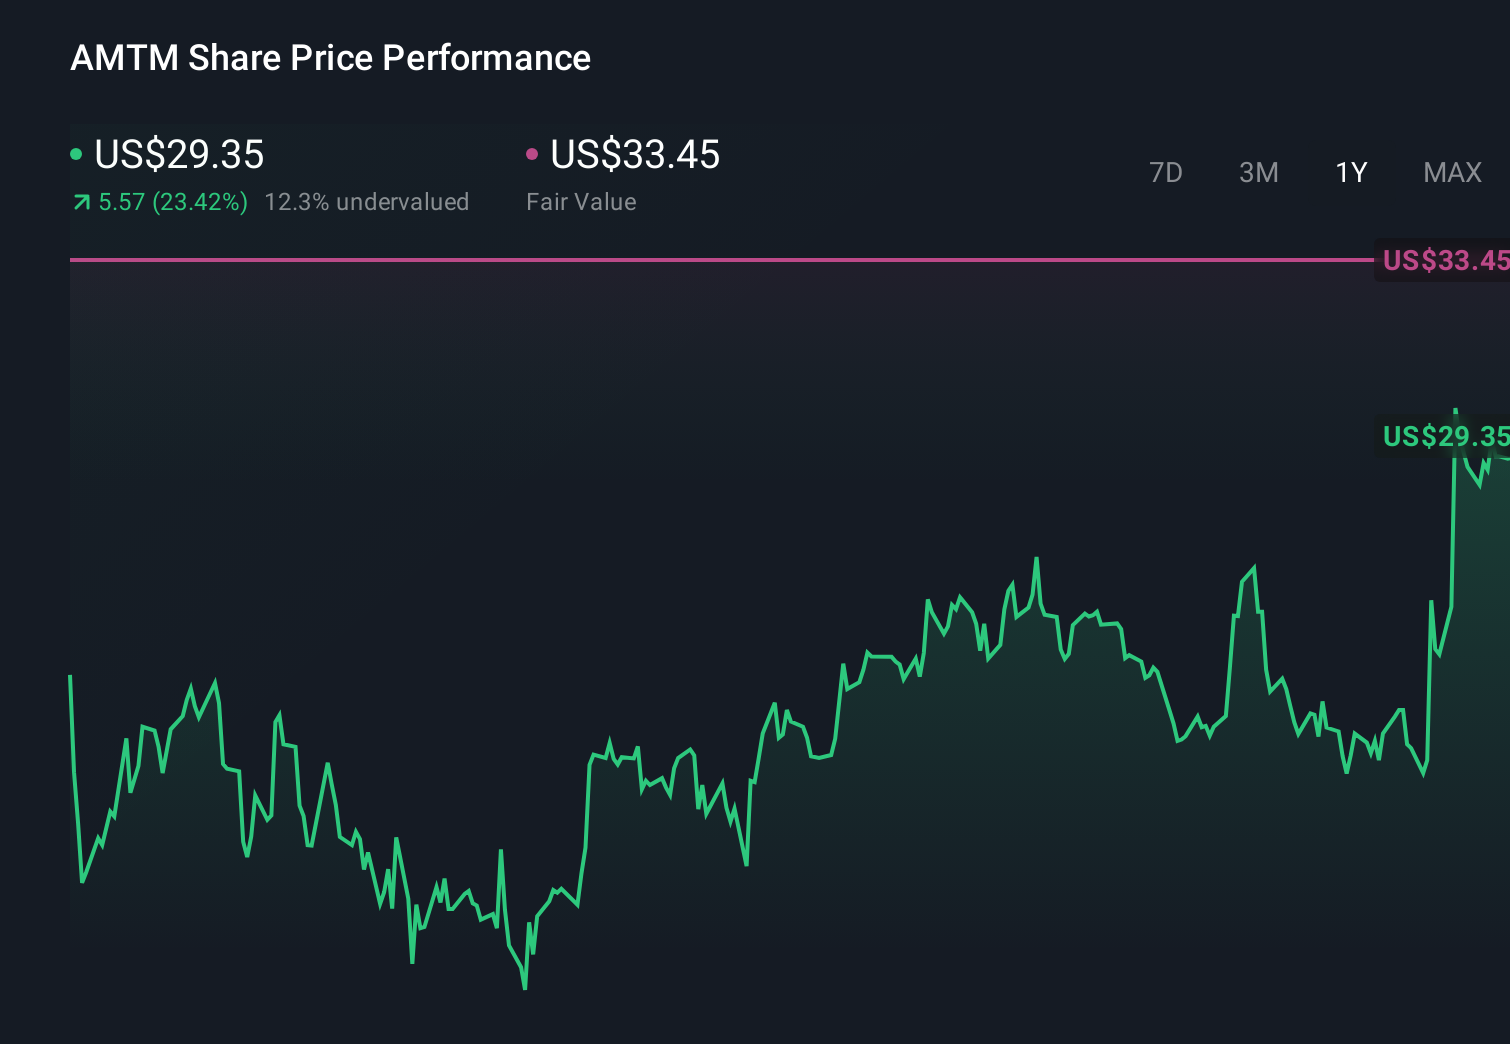
- The stock has climbed 4.3% over the last week, 17.9% over the past month, and is now up 38.1% year to date, with a striking 51.0% gain over the last year, which naturally raises the question of whether the market is getting ahead of itself or just starting to catch up.
- Recent headlines have focused on Amentum winning new long term government services contracts and expanding its role in defense, infrastructure, and mission support, which helps explain why investors are willing to pay more for the shares today. At the same time, coverage has highlighted the company as a key beneficiary of higher federal spending on complex logistics and engineering work, adding fuel to the bullish narrative built into the current price.
- Even after that run, Amentum only scores a 2/6 valuation check for being undervalued. In this article, we will look at how it appears under different valuation lenses, and then finish by exploring a more nuanced way to judge whether the market is really pricing its story correctly.
Amentum Holdings scores just 2/6 on our valuation checks. See what other red flags we found in the full valuation breakdown.
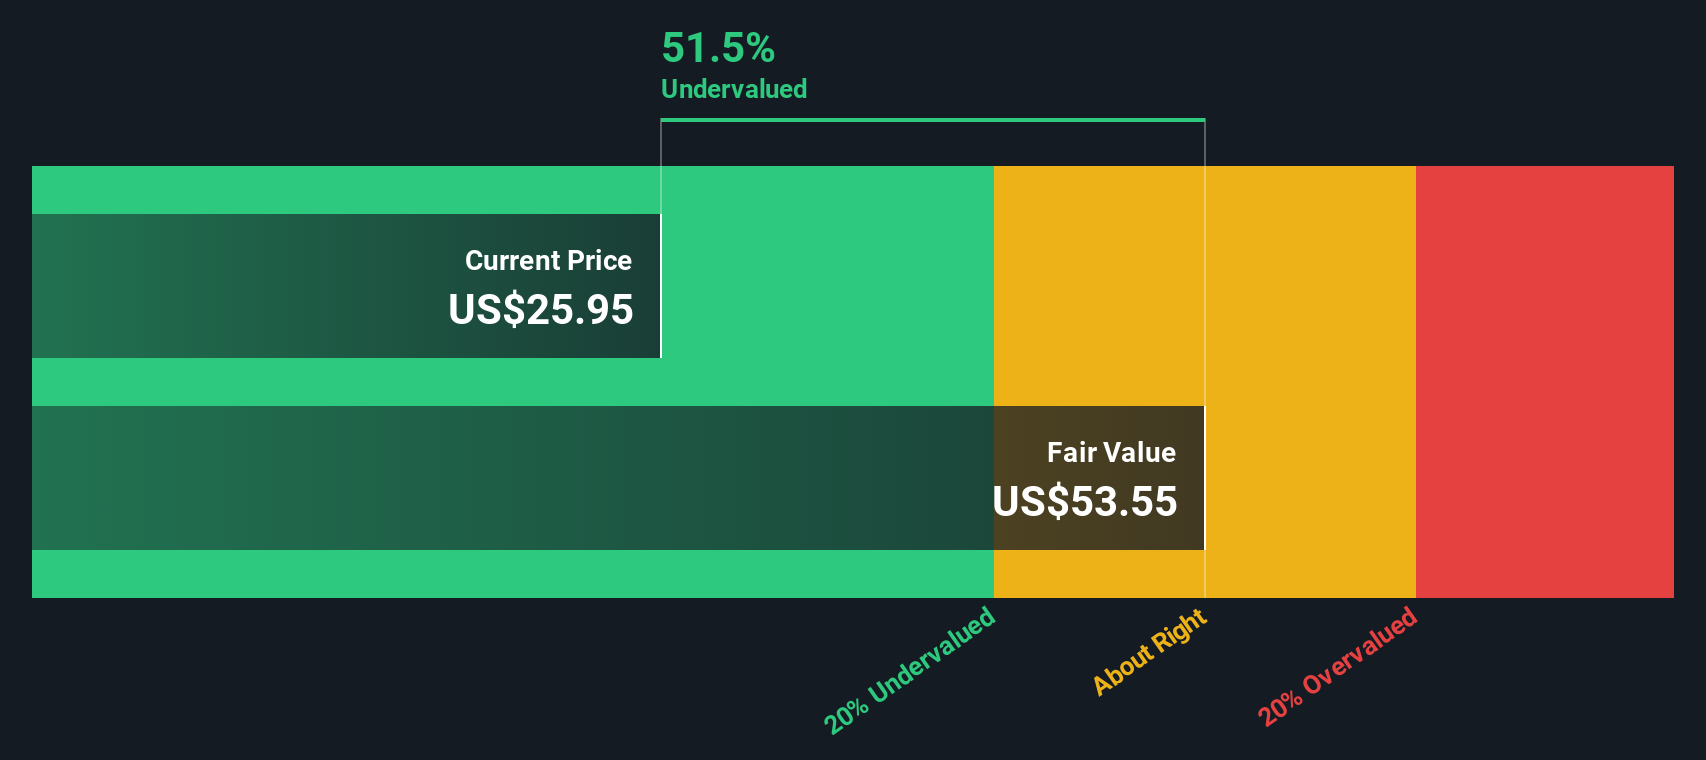
Approach 1: Amentum Holdings Discounted Cash Flow (DCF) Analysis
A Discounted Cash Flow model projects the cash Amentum Holdings could generate in the future and then discounts those cash flows back to today to estimate what the business is worth in $ right now.
Amentum currently generates about $519.4 million in free cash flow. Analysts and internal estimates see this rising steadily, with projections reaching roughly $1.15 billion by 2035 as the company expands its government services and engineering work. The 2 Stage Free Cash Flow to Equity model used here takes higher near term growth and then tapers it to more moderate levels over the longer term. This reflects a maturing but still expanding business.
On this basis, the model calculates an intrinsic value of about $68.00 per share. Compared with the current share price, this implies the stock is trading at a 56.0% discount to its estimated fair value. This suggests the market is still pricing Amentum with a substantial margin of safety.
Result: UNDERVALUED
Our Discounted Cash Flow (DCF) analysis suggests Amentum Holdings is undervalued by 56.0%. Track this in your watchlist or portfolio, or discover 901 more undervalued stocks based on cash flows.
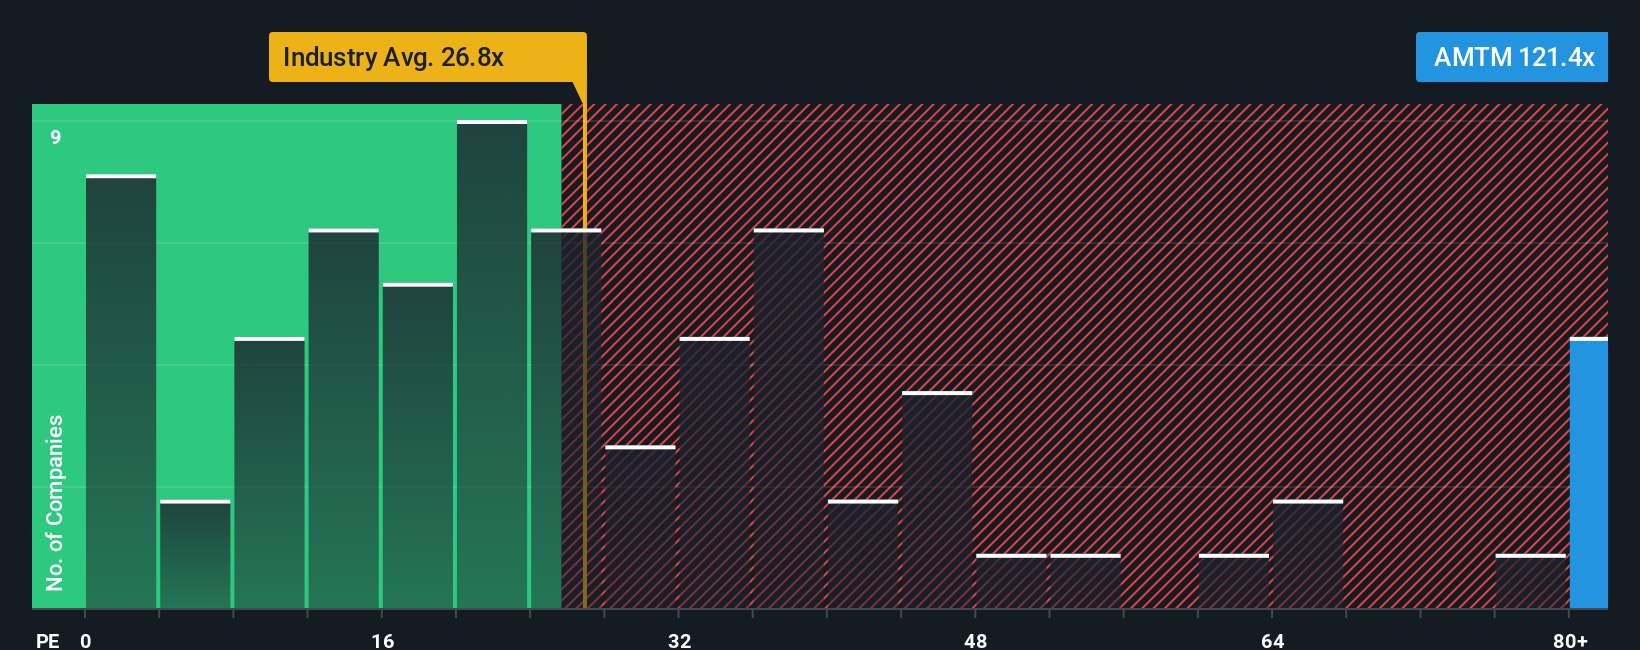
Approach 2: Amentum Holdings Price vs Earnings
For a profitable company like Amentum, the price to earnings (PE) ratio is a useful way to judge how much investors are paying for each dollar of current profits. In general, faster growing and lower risk companies justify higher PE ratios. Slower, more cyclical, or riskier businesses usually trade on lower multiples.
Amentum currently trades on a PE of about 110.4x, which is far above both the Professional Services industry average of roughly 24.2x and the broader peer group average of about 18.2x. To move beyond simple comparisons, Simply Wall St also calculates a proprietary Fair Ratio, which estimates what PE the company should trade on after accounting for its earnings growth outlook, profit margins, industry profile, market cap, and risk factors. For Amentum, this Fair Ratio is 34.0x.
Because this Fair Ratio bakes in company specific drivers rather than treating all peers as equal, it is a more nuanced yardstick than raw industry or peer averages. With the current PE of 110.4x sitting well above the 34.0x Fair Ratio, the multiple analysis indicates that Amentum’s shares look richly priced on today’s earnings.
Result: OVERVALUED
PE ratios tell one story, but what if the real opportunity lies elsewhere? Discover 1459 companies where insiders are betting big on explosive growth.
Upgrade Your Decision Making: Choose your Amentum Holdings Narrative
Earlier we mentioned that there is an even better way to understand valuation, so let us introduce you to Narratives, a simple way to connect the story you believe about a company with the numbers behind its future. A Narrative is your own investment storyline, where you describe how you think Amentum Holdings will grow, what its margins might look like, and what fair value that implies, and then link that story directly to a financial forecast and a resulting valuation. On Simply Wall St’s Community page, used by millions of investors, Narratives are an easy tool that lets you compare your fair value to the current share price so you can decide whether Amentum looks like a buy, hold, or sell today. They update automatically as fresh news, earnings, or guidance arrives, so your view stays current without you having to rebuild the whole model. For example, one Amentum Narrative might assume very strong contract wins and high long term margins, leading to a much higher fair value, while another assumes slower growth and tighter budgets, resulting in a far lower fair value and a more cautious stance.
Do you think there's more to the story for Amentum Holdings? Head over to our Community to see what others are saying!
This article by Simply Wall St is general in nature. We provide commentary based on historical data and analyst forecasts only using an unbiased methodology and our articles are not intended to be financial advice. It does not constitute a recommendation to buy or sell any stock, and does not take account of your objectives, or your financial situation. We aim to bring you long-term focused analysis driven by fundamental data. Note that our analysis may not factor in the latest price-sensitive company announcements or qualitative material. Simply Wall St has no position in any stocks mentioned.
Have feedback on this article? Concerned about the content? Get in touch with us directly. Alternatively, email editorial-team@simplywallst.com