
- PREMIUM
- LIVE QUOTES
- INSTITUTIONS
 Index Options
 State Street
 CME Group
 Nasdaq
 Cboe
Cboe TradingView
 Wall Street Journal
Has GE Vernova’s 97% 2025 Surge Already Reflected Its Energy Transition Potential?
- Wondering if GE Vernova is still worth chasing after its big run up, or whether the market has already priced in the story.
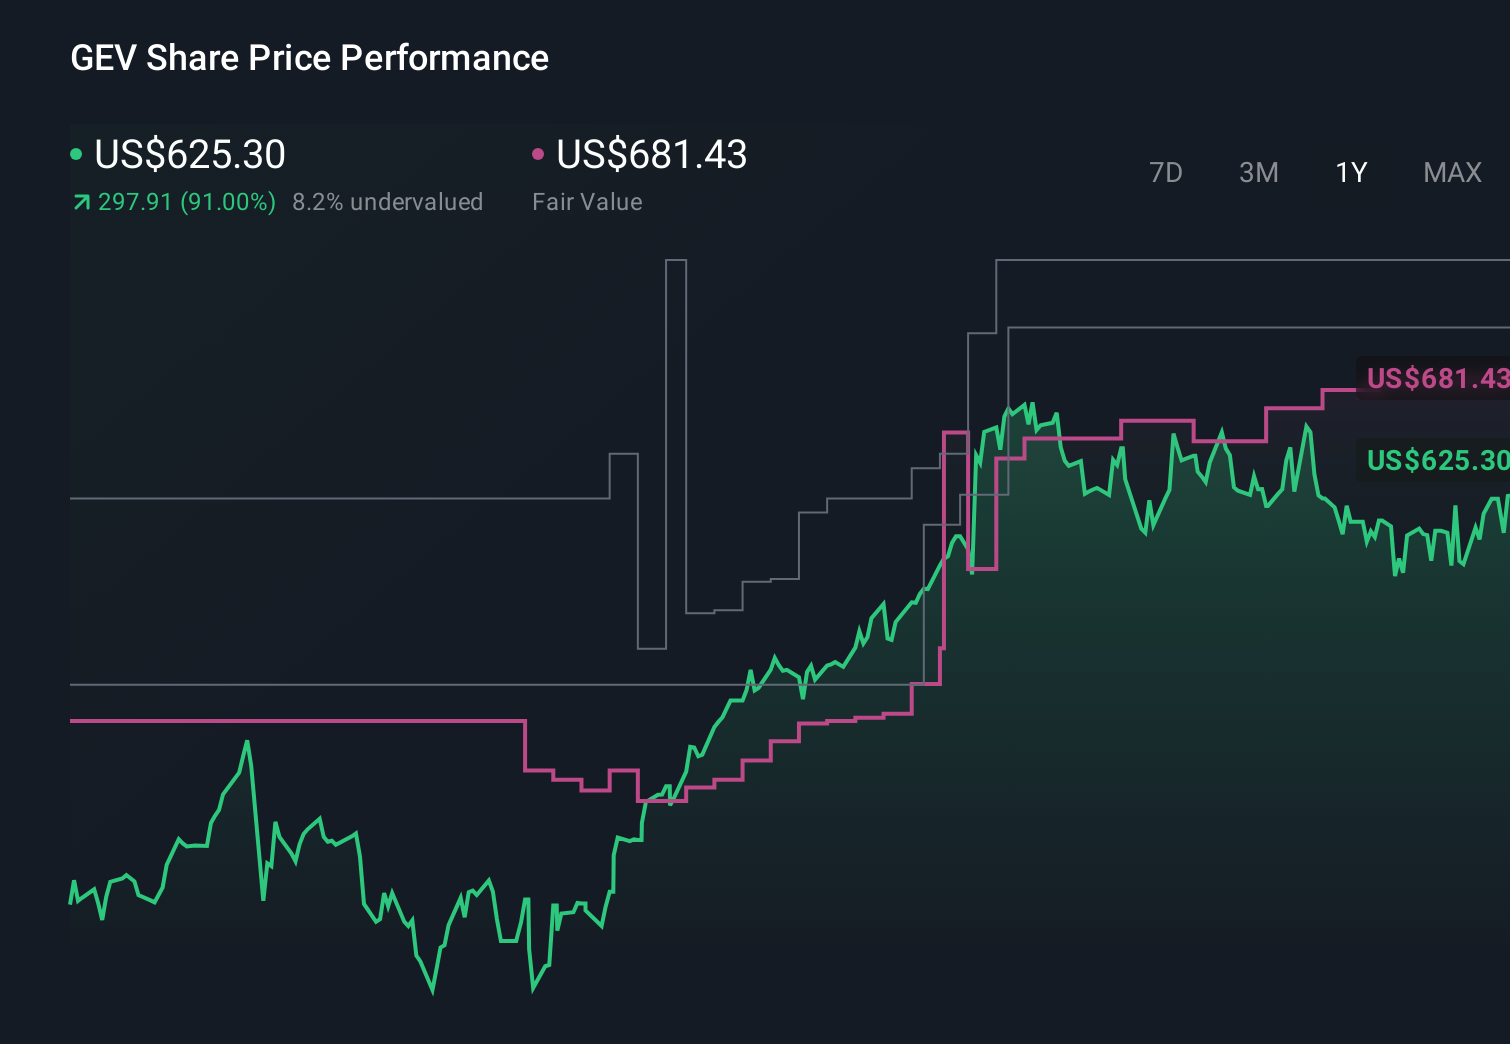
- The stock has surged recently, up 8.7% over the last week, 15.0% over the past month, and 96.9% year to date, while gaining 92.5% over the last year.
- Those moves have come as investors focus on GE Vernova's role in the energy transition and its positioning across grid, power, and renewables, which are all seeing renewed policy and capital support. At the same time, the broader market narrative around infrastructure and decarbonisation has shifted, lifting sentiment toward companies that can deliver long term, contracted cash flows in these areas.
- Despite that optimism, GE Vernova currently scores just 0/6 on our undervaluation checks. Below, we break down what different valuation methods say about the stock and then explore a more insightful way to think about its worth beyond the usual metrics.
GE Vernova scores just 0/6 on our valuation checks. See what other red flags we found in the full valuation breakdown.
Approach 1: GE Vernova Discounted Cash Flow (DCF) Analysis
A Discounted Cash Flow model estimates what a company is worth by projecting its future cash flows and discounting them back to today, using a required rate of return. For GE Vernova, the model uses a 2 Stage Free Cash Flow to Equity approach, starting from the latest twelve month Free Cash Flow of about $2.5 billion.
Analysts expect GE Vernova to grow cash flow rapidly, with projections rising to around $4.2 billion in 2026 and $5.6 billion in 2027, before extrapolated estimates push Free Cash Flow above $13.5 billion by 2035. Simply Wall St discounts these future $ cash flows back to their present value, then sums them to arrive at an intrinsic value per share of roughly $586.39.
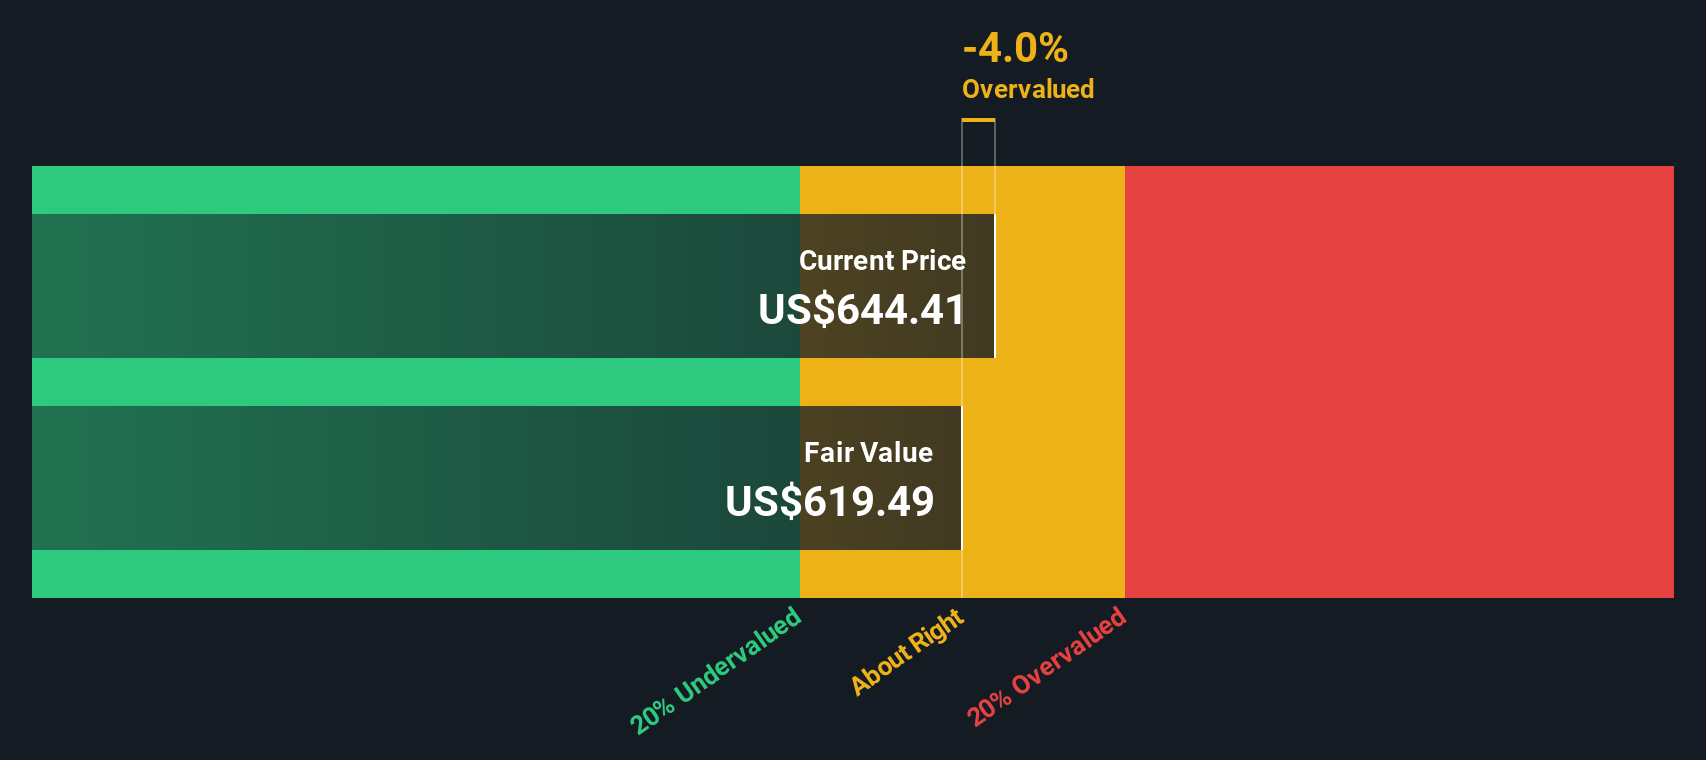
Compared with the current share price, this output from the model indicates the stock is about 13.8% overvalued on a DCF basis. This suggests the market price already reflects expectations of strong growth and execution.
Result: OVERVALUED
Our Discounted Cash Flow (DCF) analysis suggests GE Vernova may be overvalued by 13.8%. Discover 904 undervalued stocks or create your own screener to find better value opportunities.
Approach 2: GE Vernova Price vs Earnings
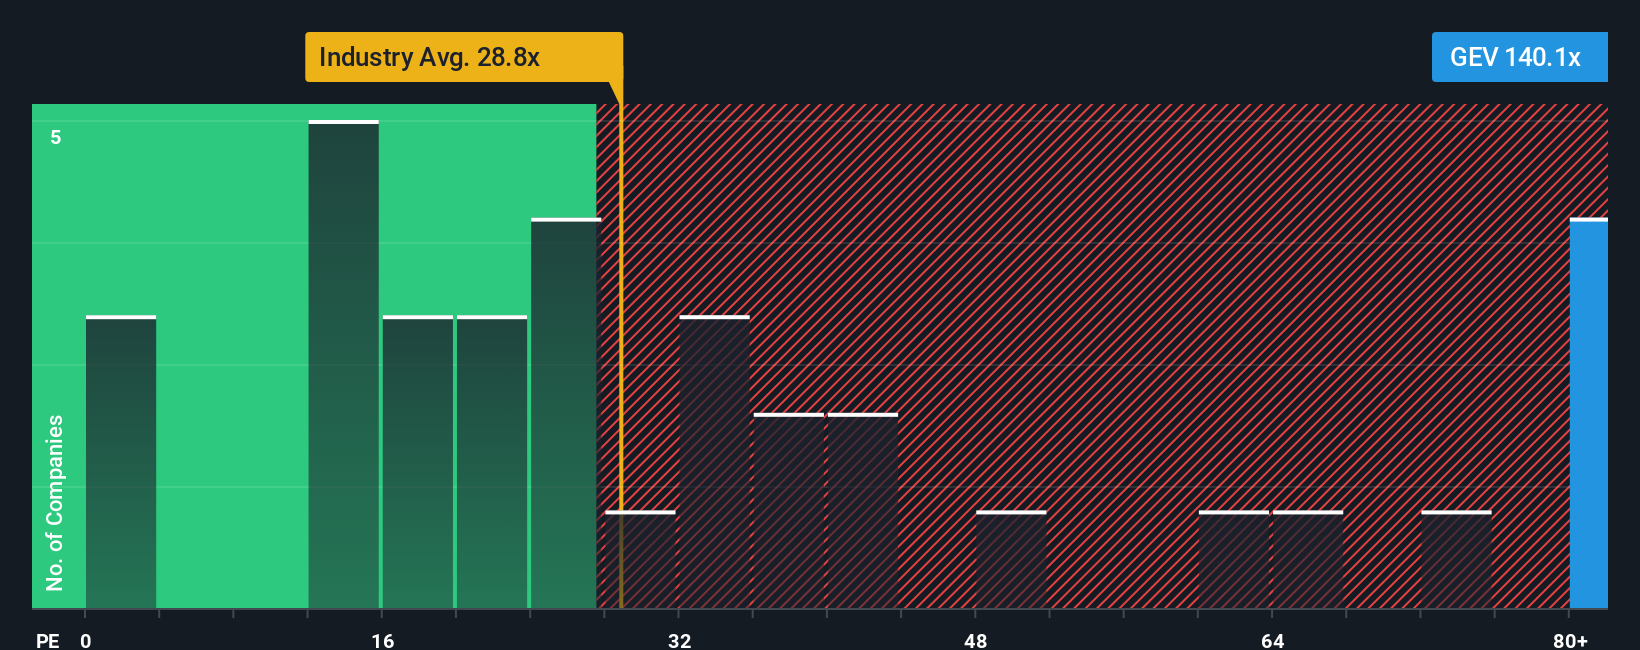
For a profitable company like GE Vernova, the price to earnings (PE) ratio is a useful way to judge whether investors are paying a reasonable price for today’s earnings, given expectations for the future. In general, faster growth and lower perceived risk justify a higher PE, while slower growth or higher risk tend to pull a “normal” or “fair” PE down.
GE Vernova currently trades on a PE of about 106.25x, which is far richer than both the Electrical industry average of roughly 30.21x and the peer group average of about 29.03x. To refine this comparison, Simply Wall St uses a proprietary “Fair Ratio” model, which estimates what PE a stock should trade on after adjusting for its earnings growth outlook, profitability, industry, market capitalization and specific risks. This Fair Ratio for GE Vernova is 79.44x, notably below the current market multiple. Because the Fair Ratio already incorporates the company’s stronger growth and risk profile, it is a more informative benchmark than simple peer or industry comparisons. The fact that GE Vernova’s actual PE sits well above this level indicates a market price that is running ahead of fundamentals.
Result: OVERVALUED
PE ratios tell one story, but what if the real opportunity lies elsewhere? Discover 1460 companies where insiders are betting big on explosive growth.
Upgrade Your Decision Making: Choose your GE Vernova Narrative
Earlier we mentioned that there is an even better way to understand valuation, so let us introduce you to Narratives.
A Narrative is simply your story about a company, written in numbers, where you connect what you believe about its competitive position, industry trends and execution to concrete assumptions for future revenue, earnings and margins, and then to your own estimate of fair value.
On Simply Wall St, Narratives are an easy tool available on the Community page that help you link GE Vernova’s story, for example rising electrification demand and grid investment, to a financial forecast and a fair value. You can then compare this with today’s share price to decide whether you see it as a buy, hold or sell.
Because Narratives on the platform are updated dynamically as new information like earnings, guidance changes or major deals such as the Taiwan repower agreement and share repurchases come through, they stay aligned with the latest data and investor expectations. One investor might build a bullish GE Vernova Narrative around accelerating grid and software growth that supports a fair value near the upper end of recent targets, while another focuses on wind losses and project risk and arrives at a far lower fair value closer to the most cautious estimates.
Do you think there's more to the story for GE Vernova? Head over to our Community to see what others are saying!
This article by Simply Wall St is general in nature. We provide commentary based on historical data and analyst forecasts only using an unbiased methodology and our articles are not intended to be financial advice. It does not constitute a recommendation to buy or sell any stock, and does not take account of your objectives, or your financial situation. We aim to bring you long-term focused analysis driven by fundamental data. Note that our analysis may not factor in the latest price-sensitive company announcements or qualitative material. Simply Wall St has no position in any stocks mentioned.
Have feedback on this article? Concerned about the content? Get in touch with us directly. Alternatively, email editorial-team@simplywallst.com