
- PREMIUM
- LIVE QUOTES
- INSTITUTIONS
 Index Options
 State Street
 CME Group
 Nasdaq
 Cboe
Cboe TradingView
 Wall Street Journal
Has the Market Already Priced in NXP Semiconductors’ Recent 17.6% Surge?
- If you are wondering whether NXP Semiconductors is still attractively priced at around $225, or if the easier gains have already been realized, you are not alone. Many investors are trying to determine what fair value looks like at this level.
- The stock has quietly added 0.9% over the last week and 17.6% over the past month, and is up 9.2% year to date. This comes on top of longer term gains of 6.5% over 1 year, 57.1% over 3 years, and 54.2% over 5 years, which naturally raises the question of how much upside may remain from here.
- Recent headlines about structural demand for automotive and industrial semiconductors, ongoing supply chain normalization, and renewed investor interest in "picks and shovels" plays on AI and edge computing have all helped support sentiment for companies like NXP Semiconductors. At the same time, broader market debates about how cyclical the chip sector really is have kept risk perceptions and valuations in constant flux.
- On our checklist of 6 valuation tests, NXP Semiconductors scores a 3 out of 6, suggesting it appears undervalued on some metrics but not others. Next we will unpack what that means by walking through different valuation approaches, before finishing with a more intuitive way to think about its potential worth.
Find out why NXP Semiconductors's 6.5% return over the last year is lagging behind its peers.
Approach 1: NXP Semiconductors Discounted Cash Flow (DCF) Analysis
A Discounted Cash Flow model estimates what a company is worth by projecting the cash it could generate in the future and then discounting those cash flows back to today in dollar terms.
For NXP Semiconductors, the latest twelve month free cash flow is about $1.5 billion. According to analysts and the model, this is expected to rise steadily, reaching around $4.6 billion by 2029, with further growth extrapolated out to 2035 using a 2 Stage Free Cash Flow to Equity approach. Near-term forecasts come from analyst estimates, while the later years are based on Simply Wall St growth assumptions.
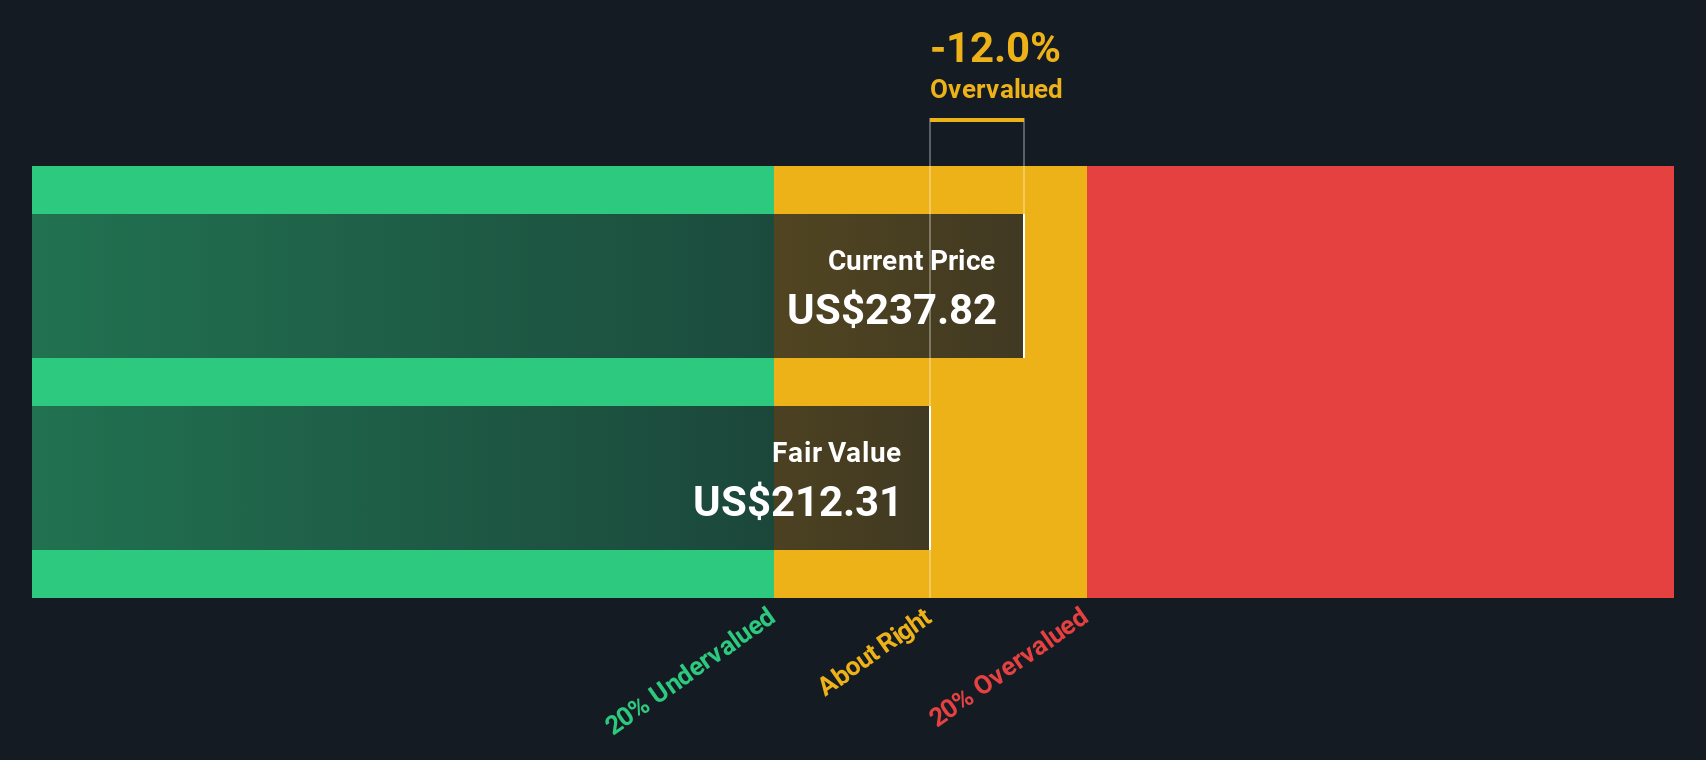
When all those future cash flows are discounted back, the model arrives at an intrinsic value of roughly $216 per share. Compared with the current price of around $225, the stock appears to be about 4.1% above this DCF estimate, suggesting it is trading close to, but slightly above, the modeled fair value.
Result: ABOUT RIGHT
NXP Semiconductors is fairly valued according to our Discounted Cash Flow (DCF), but this can change at a moment's notice. Track the value in your watchlist or portfolio and be alerted on when to act.
Approach 2: NXP Semiconductors Price vs Earnings
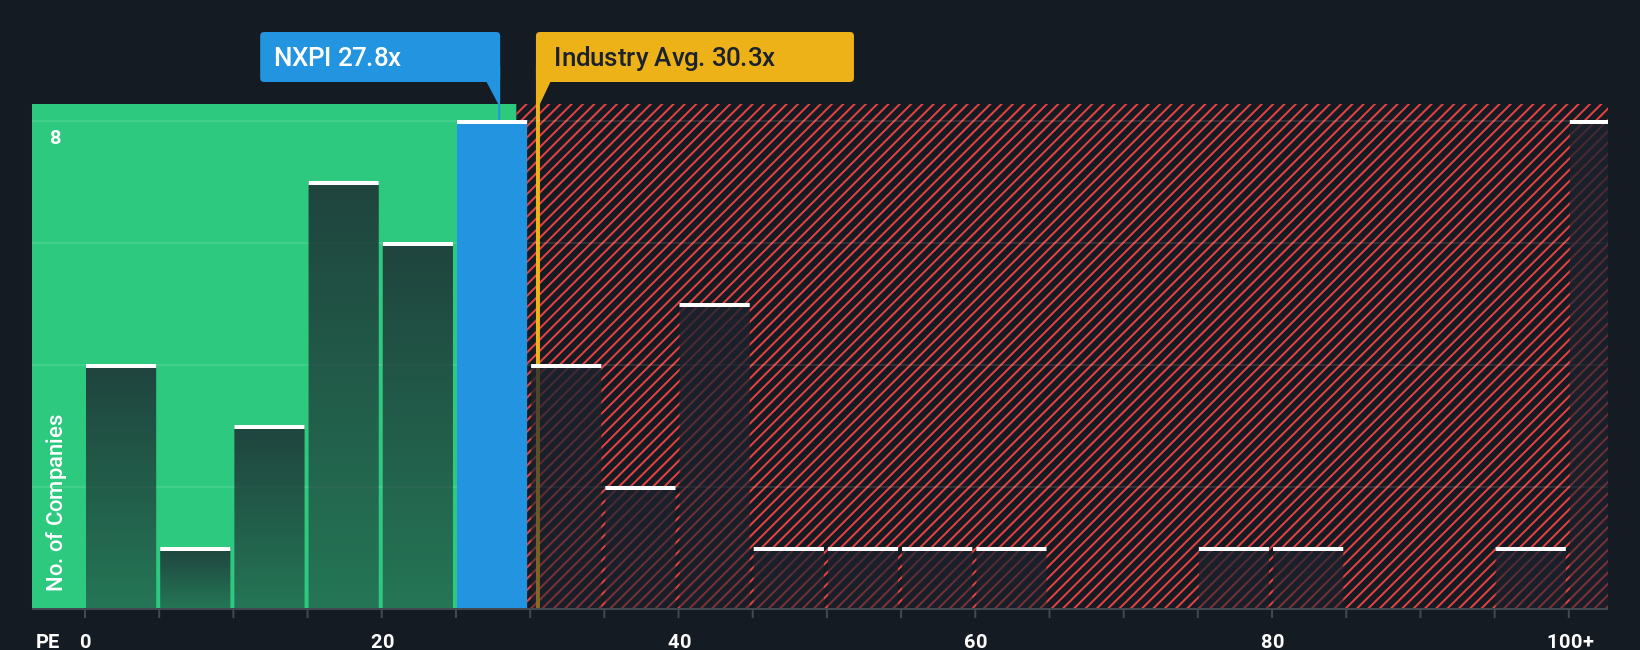
For a profitable business like NXP Semiconductors, the price to earnings ratio is a practical way to gauge whether investors are paying a reasonable price for each dollar of current profits. In general, companies with stronger, more reliable growth prospects and lower perceived risk tend to justify higher PE ratios, while slower growing or riskier businesses usually trade on lower multiples.
NXP currently trades on a PE of about 27.5x, which sits below both the broader Semiconductor industry average of roughly 36.6x and the peer group average of around 64.1x. On the surface, that discount might suggest the stock is attractively priced, but simple peer comparisons can be misleading because they ignore important differences in growth, margins, scale and risk.
To address that, Simply Wall St uses a proprietary Fair Ratio for each company. This estimates what a more tailored PE should be after factoring in NXP’s earnings growth outlook, profitability, industry, market cap and risk profile. For NXP, this Fair Ratio is about 31.1x, modestly above the current 27.5x, implying the market is applying a slight discount relative to what these fundamentals might warrant.
Result: UNDERVALUED
PE ratios tell one story, but what if the real opportunity lies elsewhere? Discover 1459 companies where insiders are betting big on explosive growth.
Upgrade Your Decision Making: Choose your NXP Semiconductors Narrative
Earlier we mentioned that there is an even better way to understand valuation, so let us introduce you to Narratives, a simple way to connect your view of NXP Semiconductors’ business to a concrete financial forecast and a fair value estimate. A Narrative is your story behind the numbers, where you outline how you think revenue, earnings and margins will evolve, and the platform translates that story into projected cash flows, a fair PE multiple and an implied fair value per share. Narratives live on Simply Wall St’s Community page, where millions of investors can quickly create, share and compare these story driven valuations. Investors can then see at a glance whether their Fair Value suggests NXP is a buy, hold or sell versus today’s price. Because Narratives update dynamically as new earnings, guidance or news arrives, your valuation view stays fresh rather than frozen in time. For example, one NXP Narrative might assume robust auto and IoT growth, margin expansion and a fair value near $289, while a more cautious Narrative bakes in slower growth and competitive pressure, landing closer to $210.
Do you think there's more to the story for NXP Semiconductors? Head over to our Community to see what others are saying!

This article by Simply Wall St is general in nature. We provide commentary based on historical data and analyst forecasts only using an unbiased methodology and our articles are not intended to be financial advice. It does not constitute a recommendation to buy or sell any stock, and does not take account of your objectives, or your financial situation. We aim to bring you long-term focused analysis driven by fundamental data. Note that our analysis may not factor in the latest price-sensitive company announcements or qualitative material. Simply Wall St has no position in any stocks mentioned.
Have feedback on this article? Concerned about the content? Get in touch with us directly. Alternatively, email editorial-team@simplywallst.com