
Has TSMC’s 48% 2025 Surge Already Priced In Its AI Growth Story?
- If you are wondering whether Taiwan Semiconductor Manufacturing is still worth buying after its huge run, you are not alone. This breakdown is designed to help you decide if the current price still makes sense.
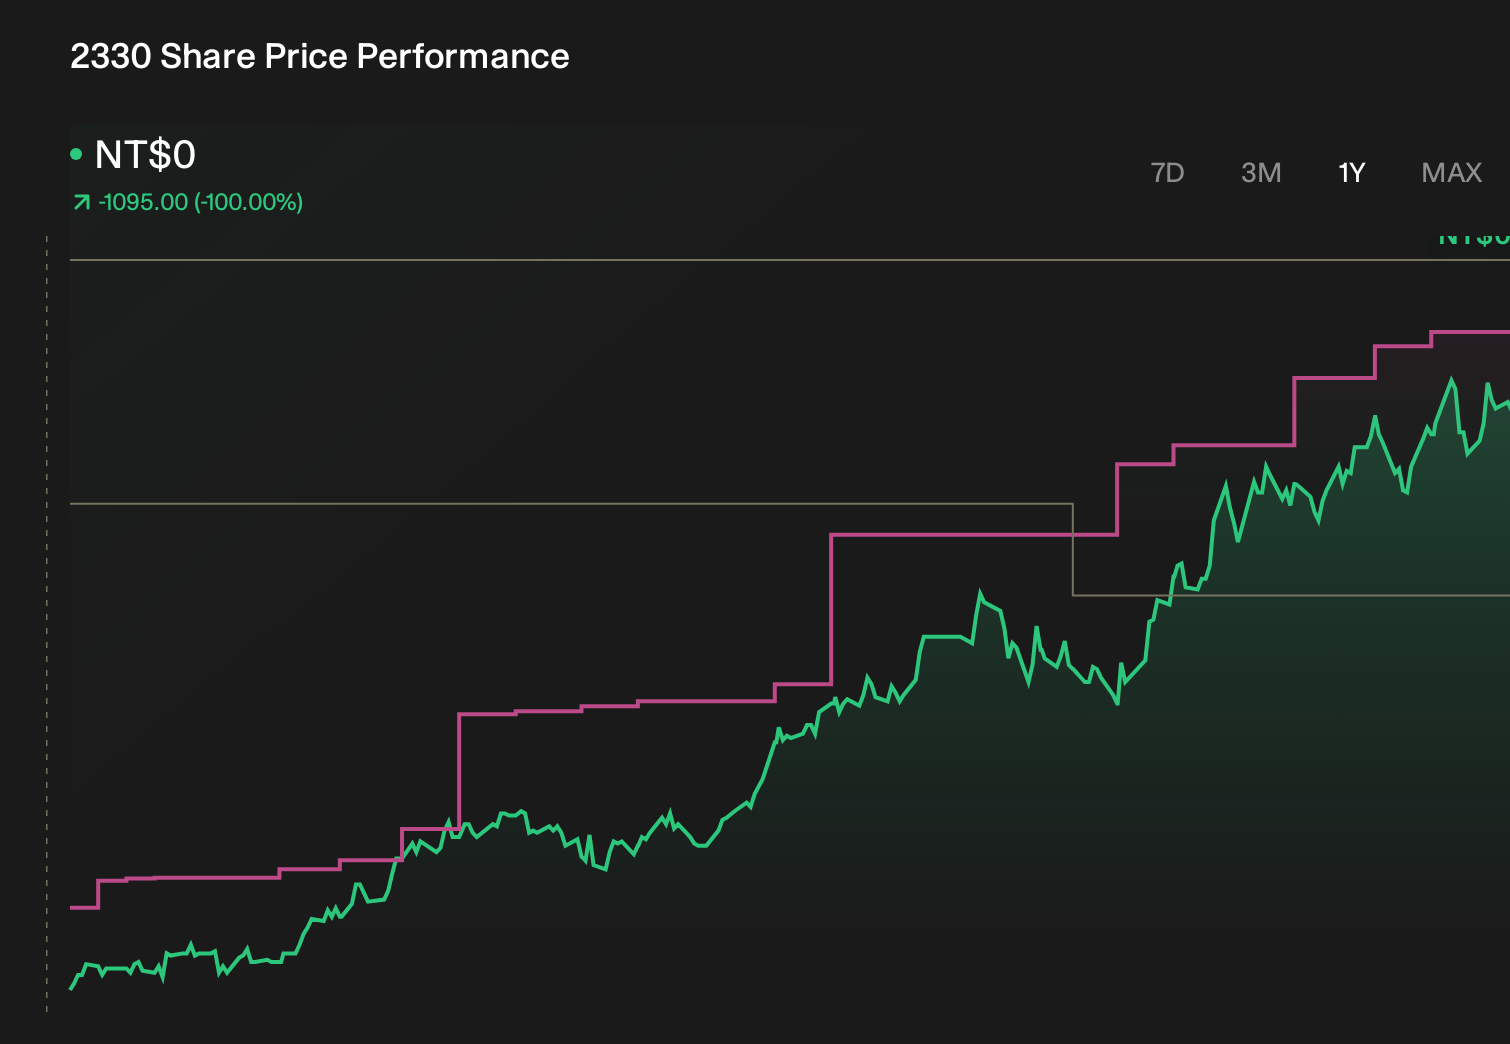
- The stock has climbed 7.9% over the last week, 5.0% over the past month, and is now up 48.2% year to date and 324.2% over three years. The big question is whether you are late to the party or the growth story still has room to run.
- Much of this momentum has been driven by surging demand for advanced chips powering AI data centers and high end smartphones, along with global policy support to secure semiconductor supply chains. At the same time, investors are watching geopolitical developments around Taiwan and new capacity expansion plans, which both add nuance to the recent price action.
- On our framework, Taiwan Semiconductor Manufacturing scores a 3 out of 6 valuation score, which suggests the market is only partially pricing in its fundamentals. In the next sections we will compare different valuation approaches before finishing with an even more practical way to think about what the stock is really worth.
Approach 1: Taiwan Semiconductor Manufacturing Discounted Cash Flow (DCF) Analysis
A Discounted Cash Flow model estimates what a company is worth by projecting the cash it can generate in the future and discounting those cash flows back to today. For Taiwan Semiconductor Manufacturing, this 2 Stage Free Cash Flow to Equity model starts from last twelve month free cash flow of roughly NT$802.4 Billion and then layers on analyst forecasts and longer term extrapolations.
Analysts expect free cash flow to climb to around NT$1.35 Trillion by 2026 and NT$1.87 Trillion by 2027, with Simply Wall St extending those projections further out as growth gradually slows. By 2035, the model assumes free cash flow reaches about NT$3.27 Trillion, illustrating how much cash the business could be generating if current trends continue.
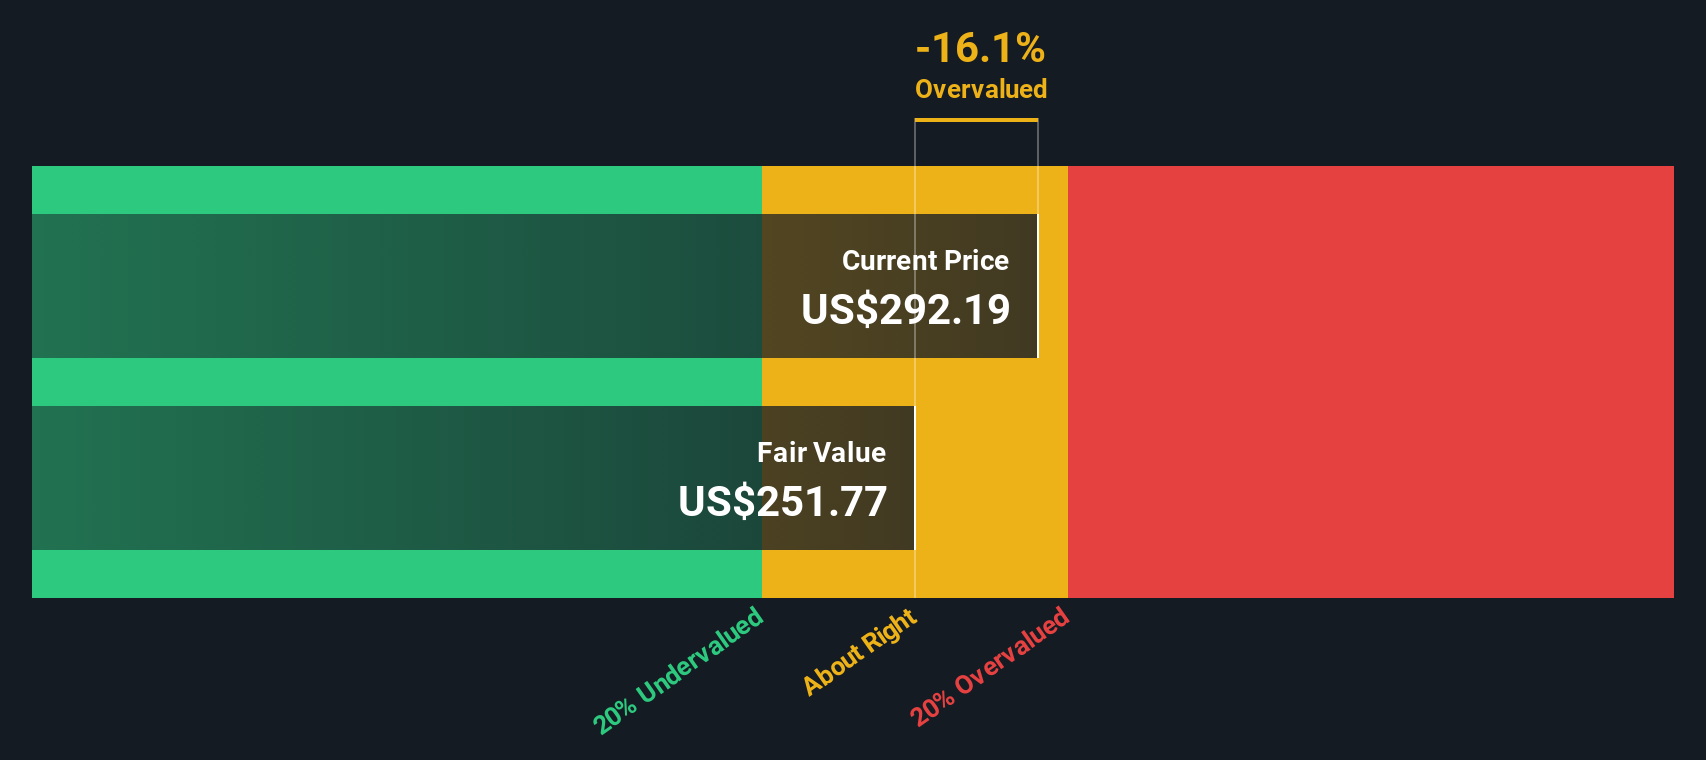
Discounting all those future NT$ cash flows back to today produces an estimated intrinsic value of about $216.39 per share. Compared with the current market price, the DCF implies the stock is roughly 38.1% overvalued, indicating that a large portion of the future growth narrative may already be reflected in the share price.
Result: OVERVALUED
Our Discounted Cash Flow (DCF) analysis suggests Taiwan Semiconductor Manufacturing may be overvalued by 38.1%. Discover 905 undervalued stocks or create your own screener to find better value opportunities.
Approach 2: Taiwan Semiconductor Manufacturing Price vs Earnings
For a profitable, relatively mature business like Taiwan Semiconductor Manufacturing, the price to earnings ratio is a useful way to judge whether investors are paying a sensible price for each dollar of profit. In general, companies with stronger growth prospects and lower perceived risk can justify a higher PE, while slower growing or riskier firms typically deserve a lower multiple.
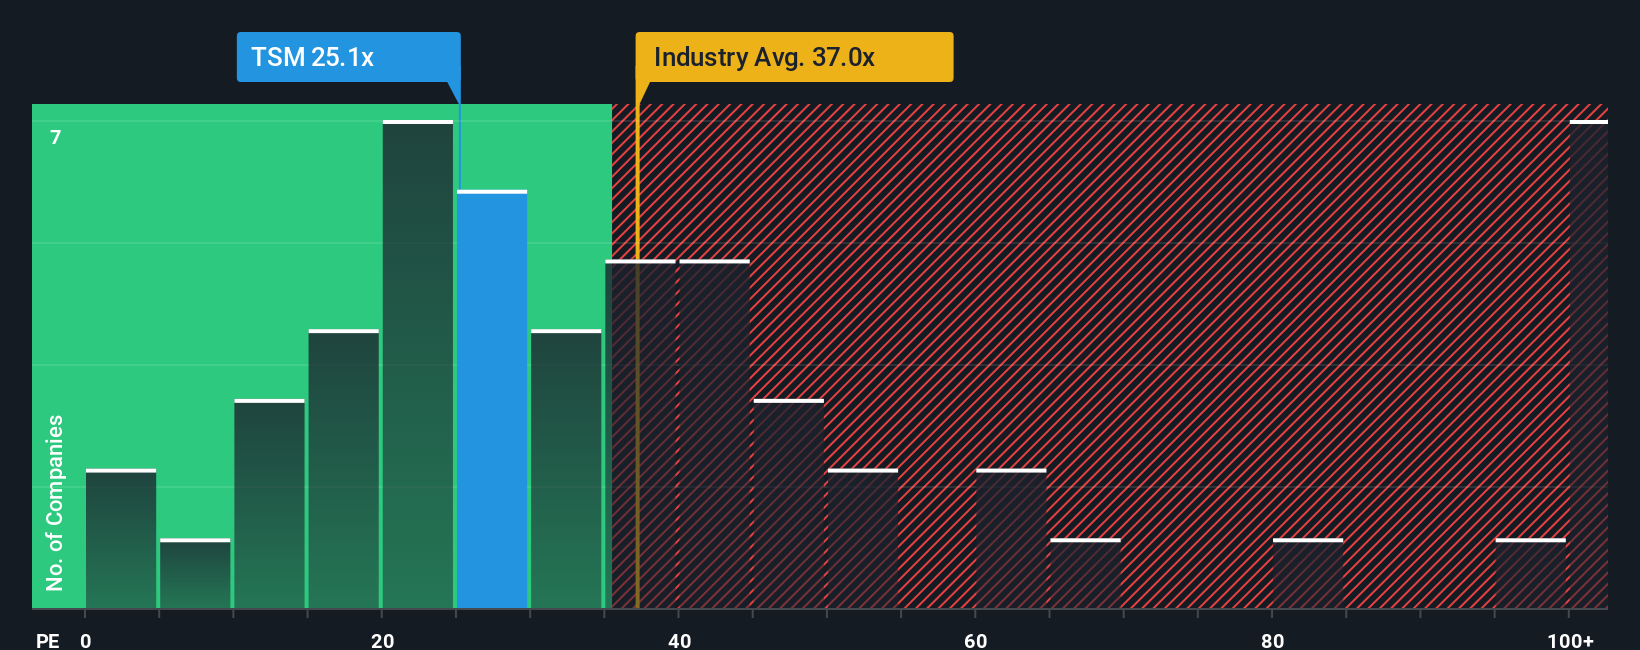
Right now, TSM trades on about 24.7x earnings, which is below both the semiconductor industry average of roughly 36.6x and the broader peer group average of around 61.1x. At first glance, that discount might suggest the stock is attractively priced, but simple peer comparisons can be misleading because they ignore differences in growth, profitability, size and risk.
Simply Wall St’s Fair Ratio tackles this by estimating what PE multiple would be justified for TSM given its specific earnings growth outlook, industry position, profit margins, market cap and risk profile. For TSM, that Fair Ratio sits closer to 37.6x. In this framework, the model implies investors might be willing to pay more than the current 24.7x for the company’s earnings, which signals potential upside on a multiples basis.
Result: UNDERVALUED
PE ratios tell one story, but what if the real opportunity lies elsewhere? Discover 1459 companies where insiders are betting big on explosive growth.
Upgrade Your Decision Making: Choose your Taiwan Semiconductor Manufacturing Narrative
Earlier we mentioned that there is an even better way to understand valuation, so let us introduce you to Narratives, a simple way to connect your view of Taiwan Semiconductor Manufacturing’s story with the numbers by translating your assumptions about its future revenue, earnings and margins into a financial forecast and fair value estimate that you can easily compare to today’s share price.
On Simply Wall St’s Community page, Narratives are an accessible tool used by millions of investors to spell out why they think a company will win or struggle, linking qualitative factors like AI leadership, capacity expansion, and geopolitical risk directly to a dynamic valuation that automatically updates when new information such as earnings, guidance or major news is released.
For example, one Taiwan Semiconductor Manufacturing Narrative might focus on its dominant AI foundry position, strong margins in the high performance computing segment and ongoing global fab expansion to justify a higher fair value around $310 per share. In contrast, a more cautious Narrative might stress geopolitical tension, overseas cost inflation and customer concentration to arrive at a lower fair value. By comparing each Narrative’s Fair Value with the current market price, investors can quickly decide how they view Taiwan Semiconductor Manufacturing based on the story they believe.
Do you think there's more to the story for Taiwan Semiconductor Manufacturing? Head over to our Community to see what others are saying!
This article by Simply Wall St is general in nature. We provide commentary based on historical data and analyst forecasts only using an unbiased methodology and our articles are not intended to be financial advice. It does not constitute a recommendation to buy or sell any stock, and does not take account of your objectives, or your financial situation. We aim to bring you long-term focused analysis driven by fundamental data. Note that our analysis may not factor in the latest price-sensitive company announcements or qualitative material. Simply Wall St has no position in any stocks mentioned.
Have feedback on this article? Concerned about the content? Get in touch with us directly. Alternatively, email editorial-team@simplywallst.com