
- PREMIUM
- LIVE QUOTES
- INSTITUTIONS
 Index Options
 State Street
 CME Group
 Nasdaq
 Cboe
Cboe TradingView
 Wall Street Journal
Is It Too Late To Consider Ocular Therapeutix After Its Strong 2025 Share Price Rally?
- Wondering if Ocular Therapeutix at around $12.71 is still a smart way to play biotech upside, or if most of the easy gains are already priced in? You are not alone.
- The stock is up 45.4% year to date and 52.6% over the last year, even after a recent 7.4% pullback this week and a more modest 5.0% gain over the last month. This builds on a 381.4% return over three years, despite being down 37.5% across five years.
- Recent moves have been driven by growing interest in Ocular Therapeutix's drug delivery platform and progress in its ophthalmology pipeline, which have put the company back on the radar for growth focused investors. At the same time, shifting sentiment toward small cap biotech has added a bit more volatility, as traders reprice both the upside and the risks around its future products.
- On our simple valuation checklist, Ocular Therapeutix scores just 2/6 for being undervalued. This suggests that some metrics flag opportunity while others flash caution. Next, we will break down what each major valuation approach is actually saying, before finishing with a more holistic way to judge what the market might be missing.
Ocular Therapeutix scores just 2/6 on our valuation checks. See what other red flags we found in the full valuation breakdown.
Approach 1: Ocular Therapeutix Discounted Cash Flow (DCF) Analysis
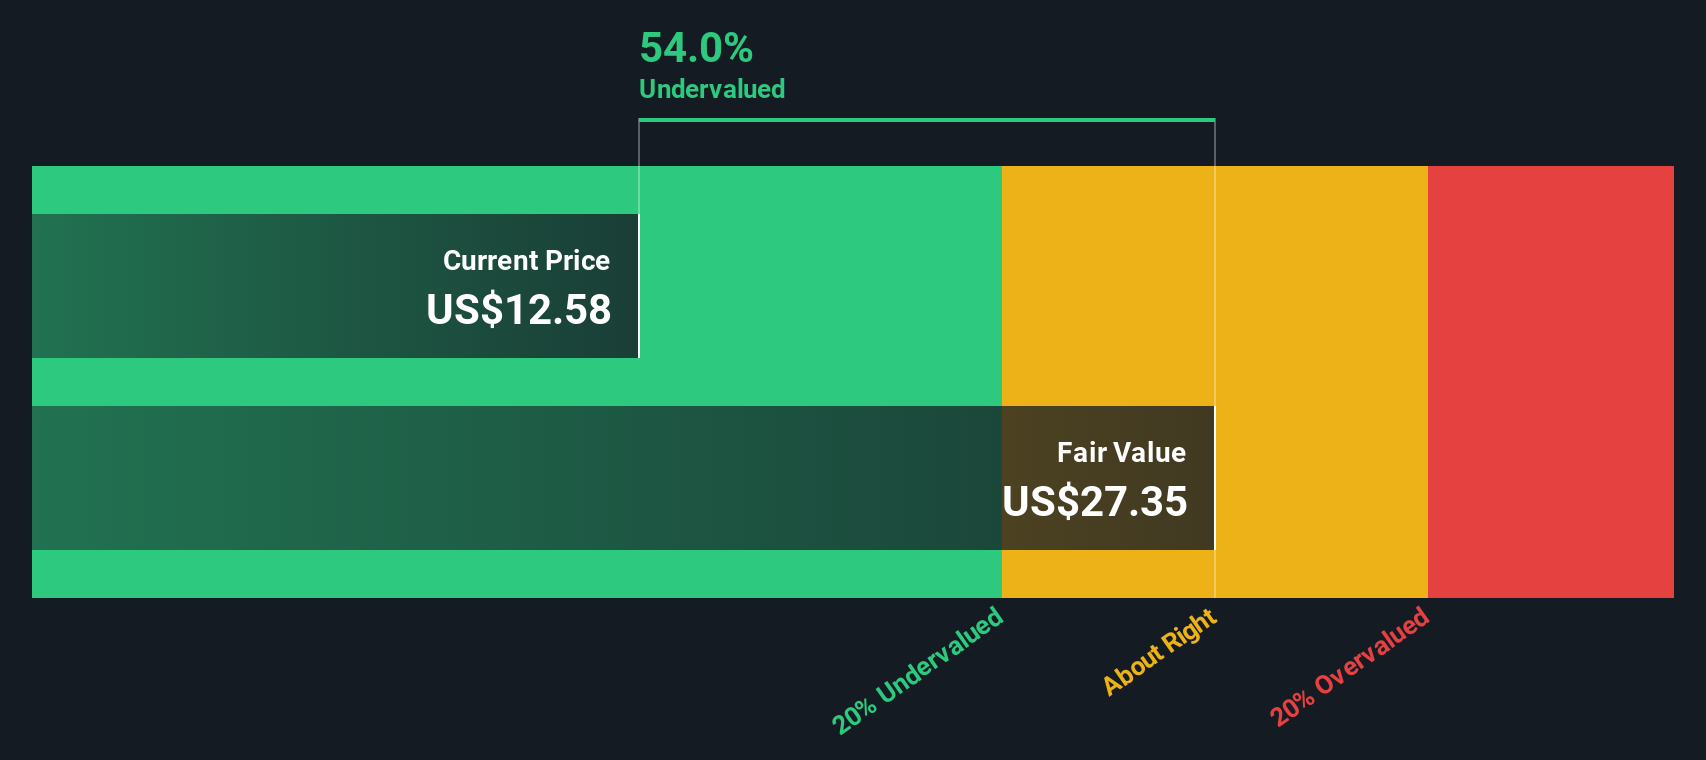
A Discounted Cash Flow model estimates what a company is worth by projecting its future cash flows and then discounting those back to today in $ terms. For Ocular Therapeutix, the 2 Stage Free Cash Flow to Equity model starts from last twelve month free cash flow of about $196 million in the red, highlighting that the business is still heavily cash consuming rather than cash generating.
Analysts expect those outflows to gradually shrink and then flip to positive, with projected free cash flow of roughly $80 million by 2029. Beyond the analyst horizon, Simply Wall St extrapolates further growth so that by 2035 free cash flow could reach about $367 million, which would support a much higher equity value if execution goes to plan.
When these projected cash flows are discounted back, the model arrives at an intrinsic value of about $27.35 per share, implying the stock is trading at roughly a 53.5% discount to this estimate. On this cash flow view, Ocular Therapeutix screens as significantly undervalued rather than fully priced.
Result: UNDERVALUED
Our Discounted Cash Flow (DCF) analysis suggests Ocular Therapeutix is undervalued by 53.5%. Track this in your watchlist or portfolio, or discover 905 more undervalued stocks based on cash flows.
Approach 2: Ocular Therapeutix Price vs Sales
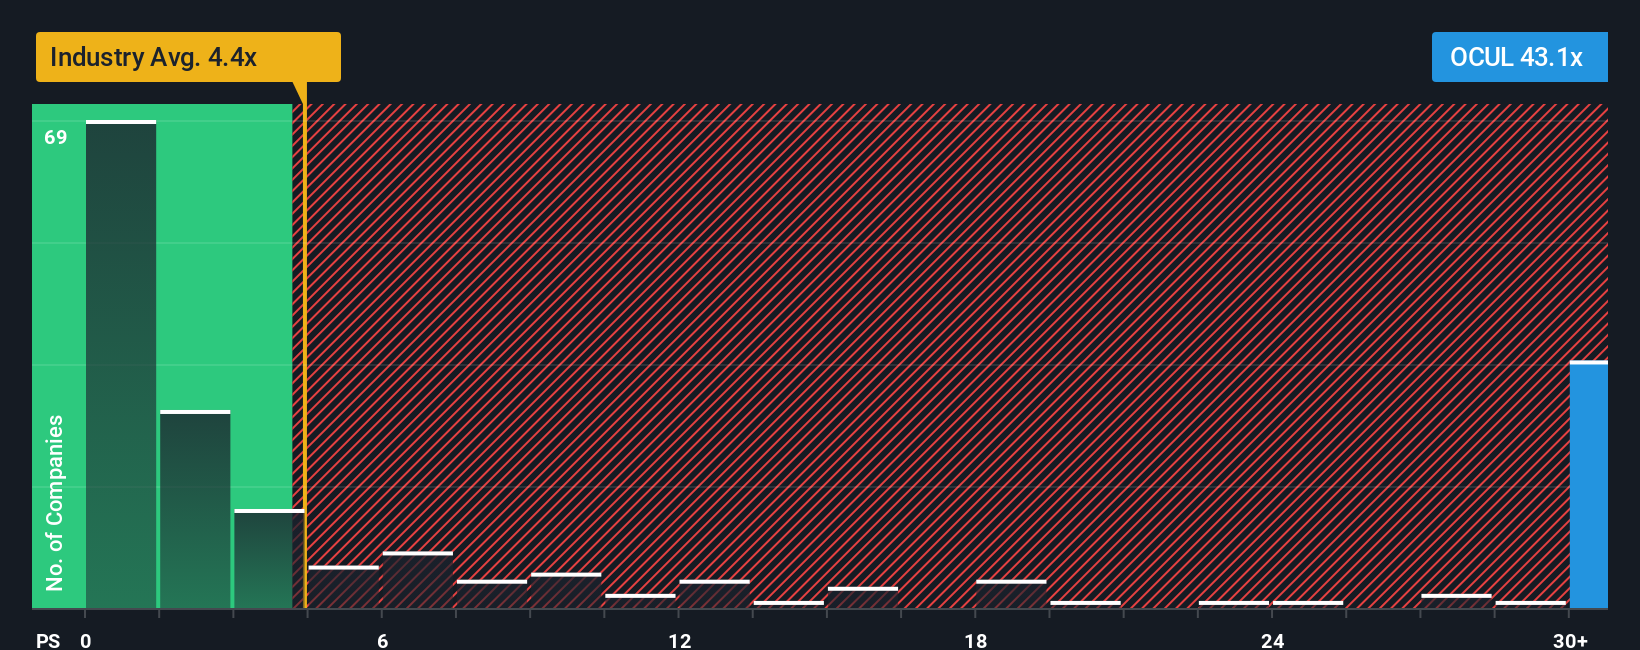
For high growth or loss making biotechs, earnings are often negative, so investors commonly lean on the Price to Sales multiple to gauge valuation. Sales are harder to manipulate than near term earnings for such companies, making this a cleaner way to compare how much the market is paying for each dollar of revenue.
In general, the higher a company’s expected growth and the lower its perceived risk, the higher a “normal” or “fair” multiple investors are willing to pay. For Ocular Therapeutix, the current Price to Sales ratio sits at 48.54x, far above both the Pharmaceuticals industry average of 4.35x and the peer group average of 5.69x, which implies a very rich headline valuation.
Simply Wall St’s Fair Ratio is a proprietary estimate of what the Price to Sales multiple should be once you factor in the company’s growth outlook, profitability profile, industry positioning, market cap and specific risks. That makes it more informative than a simple peer or sector comparison. On this measure, Ocular Therapeutix’s Fair Ratio is around 0.49x, which is dramatically below the current 48.54x. This suggests that, even allowing for strong growth optionality, the shares appear significantly overvalued on a sales basis.
Result: OVERVALUED
PS ratios tell one story, but what if the real opportunity lies elsewhere? Discover 1459 companies where insiders are betting big on explosive growth.
Upgrade Your Decision Making: Choose your Ocular Therapeutix Narrative
Earlier we mentioned that there is an even better way to understand valuation, so let us introduce you to Narratives, a simple idea where you attach a story about a company to the numbers you think are realistic for its future revenue, earnings, margins and fair value, then see how that stacks up against today’s share price.
A Narrative takes your view of Ocular Therapeutix’s business, builds a financial forecast from it and then converts that forecast into a fair value estimate, giving you a clear bridge from story, to numbers, to a potential investment decision based on how far fair value sits above or below the current price.
On Simply Wall St’s Community page, where millions of investors share ideas, Narratives are easy to create, compare and update. They automatically refresh when new information like trial updates, earnings or regulatory news arrives, so your thesis is never static.
For example, one investor might build a bullish Ocular Therapeutix Narrative with a fair value of around $24 per share based on strong AXPAXLI adoption and accelerating revenue growth. A more cautious investor might anchor on the lower end of analyst targets near $14 per share, reflecting higher execution and regulatory risk. Narratives makes both perspectives visible and testable against live market prices.
Do you think there's more to the story for Ocular Therapeutix? Head over to our Community to see what others are saying!

This article by Simply Wall St is general in nature. We provide commentary based on historical data and analyst forecasts only using an unbiased methodology and our articles are not intended to be financial advice. It does not constitute a recommendation to buy or sell any stock, and does not take account of your objectives, or your financial situation. We aim to bring you long-term focused analysis driven by fundamental data. Note that our analysis may not factor in the latest price-sensitive company announcements or qualitative material. Simply Wall St has no position in any stocks mentioned.
Have feedback on this article? Concerned about the content? Get in touch with us directly. Alternatively, email editorial-team@simplywallst.com