
- PREMIUM
- LIVE QUOTES
- INSTITUTIONS
 Index Options
 State Street
 CME Group
 Nasdaq
 Cboe
Cboe TradingView
 Wall Street Journal
Assessing ServiceNow After 27.6% Slide and Strong Enterprise Deal Momentum
- If you are wondering whether ServiceNow is starting to look like a bargain or still priced for perfection, you are in the right place.
- Despite a tough stretch recently, with the stock down around 2.5% over the last week, 6.5% over the last month, and 27.6% year to date, long term holders are still sitting on gains of about 103% over three years.
- Recent headlines have focused on ServiceNow continuing to win large enterprise deals and deepening partnerships across its platform. This reinforces the idea that it remains a core player in digital workflow automation. At the same time, some analysts and investors have been debating whether growth expectations have run ahead of what is realistically achievable in the current macro environment, which helps explain the recent share price pullback.
- For valuation, Simply Wall St currently gives ServiceNow a 3/6 value score, reflecting that it screens as undervalued on half of the key checks. In the next sections, we will walk through those valuation approaches, and then finish with an even more useful way of thinking about what ServiceNow is really worth.
Find out why ServiceNow's -31.0% return over the last year is lagging behind its peers.
Approach 1: ServiceNow Discounted Cash Flow (DCF) Analysis
The Discounted Cash Flow model estimates what a company is worth by projecting its future cash flows and then discounting those back to today in $, to reflect risk and the time value of money.
ServiceNow generated roughly $3.9 billion in free cash flow over the last twelve months, and analysts expect this to rise steadily as the business scales. Simply Wall St uses analyst forecasts for the next few years, then extrapolates beyond that with projected free cash flow reaching around $15.1 billion by 2035. These long term cash flow projections are then discounted back to today using a 2 stage Free Cash Flow to Equity model.
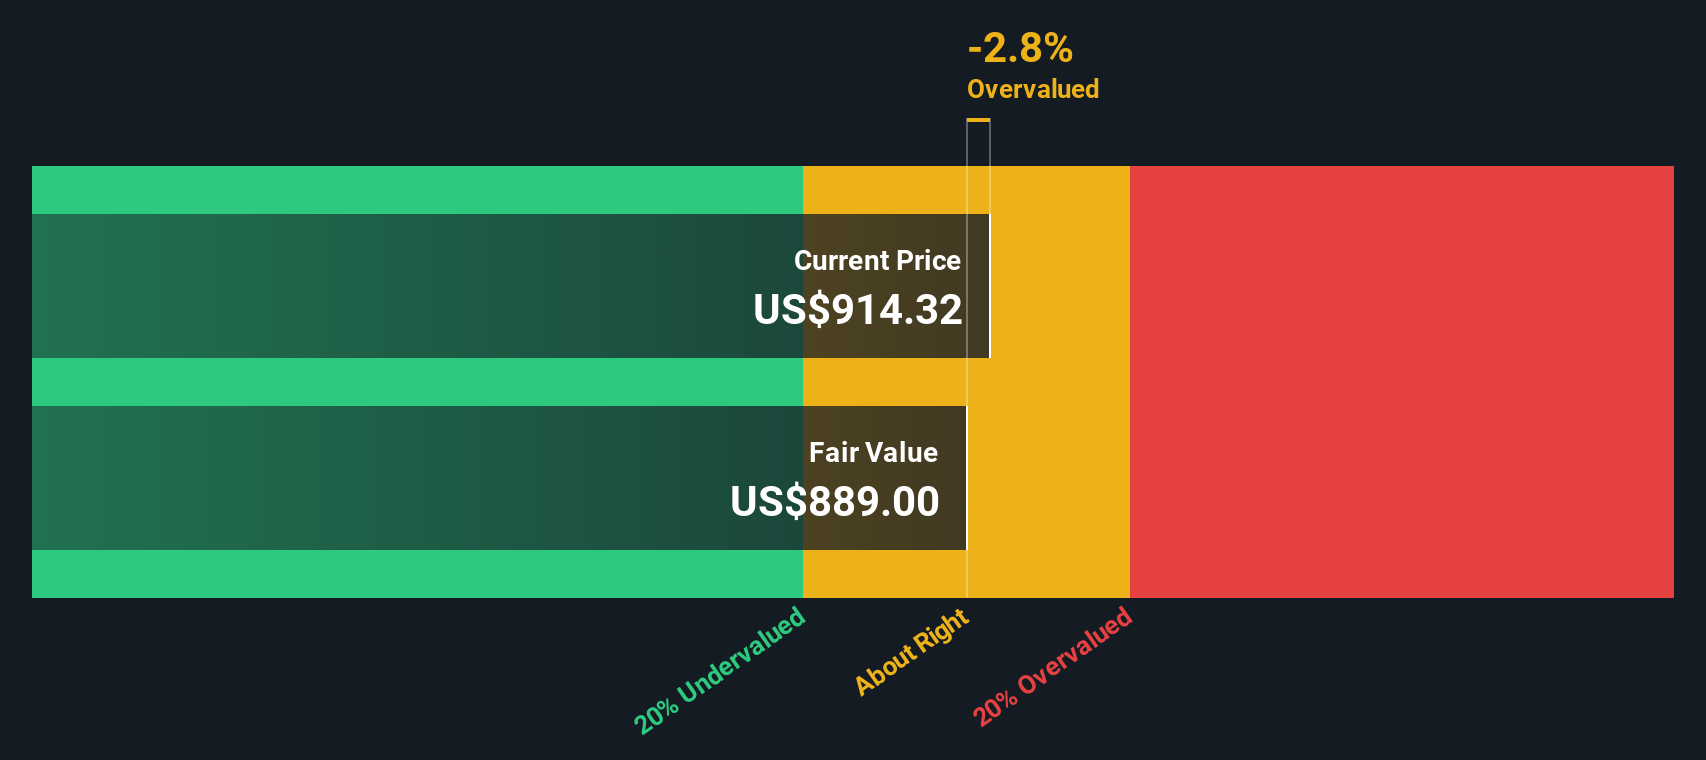
On this basis, the DCF model arrives at an intrinsic value of about $190.83 per share. Compared with the current share price, this implies the stock is trading at roughly a 20.0% discount, suggesting it is meaningfully undervalued on cash flow fundamentals.
Result: UNDERVALUED
Our Discounted Cash Flow (DCF) analysis suggests ServiceNow is undervalued by 20.0%. Track this in your watchlist or portfolio, or discover 905 more undervalued stocks based on cash flows.
Approach 2: ServiceNow Price vs Earnings
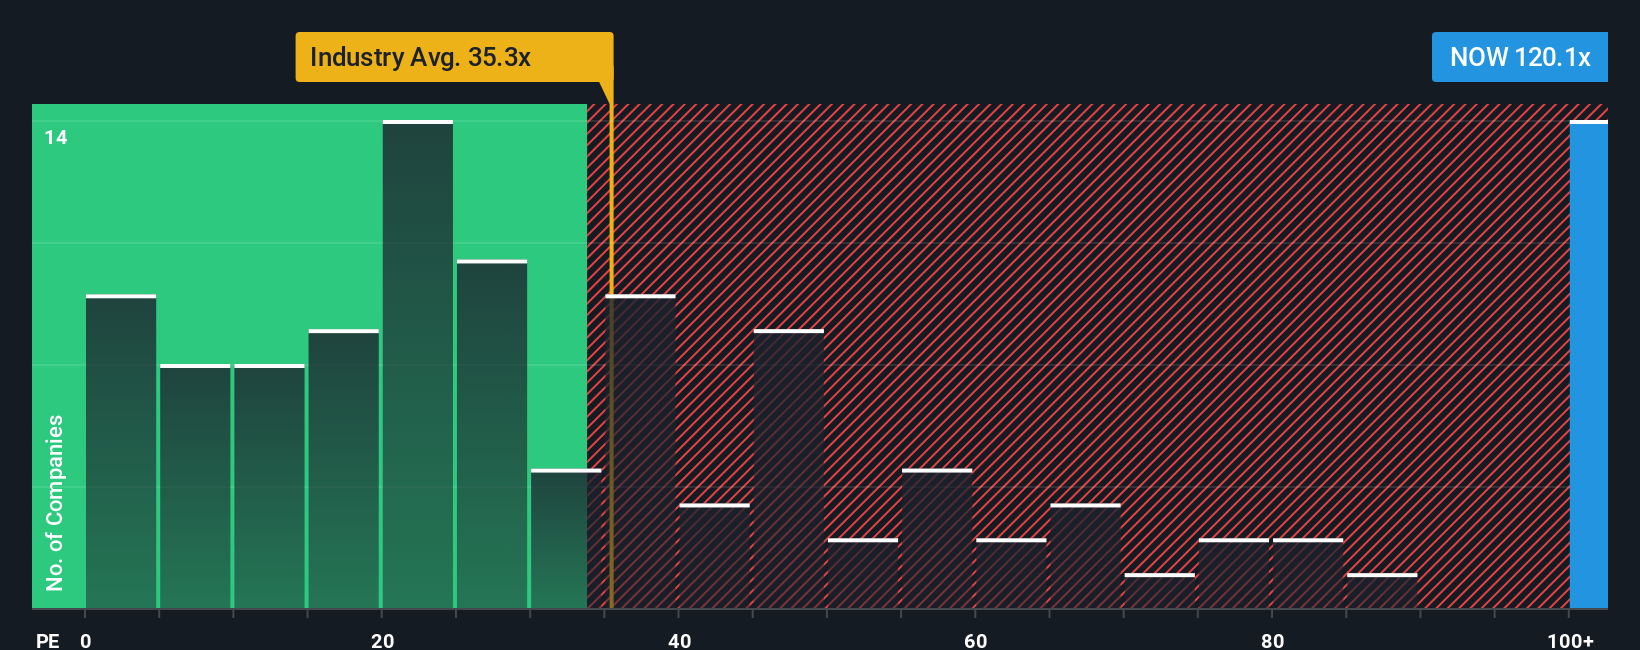
For a profitable, mature growth business like ServiceNow, the price to earnings, or PE, ratio is a useful way to gauge what investors are willing to pay for each dollar of current earnings. A higher PE can be justified when a company is expected to grow faster and is seen as lower risk, while slower growth or higher uncertainty usually means the PE should sit closer to, or below, the market and industry averages.
ServiceNow currently trades on a PE of about 91.4x, which is well above both the broader software industry average of roughly 31.9x and its peer group average of around 51.5x. To move beyond these simple comparisons, Simply Wall St uses a proprietary Fair Ratio, which estimates what PE multiple would be reasonable given the company’s earnings growth outlook, profitability, industry, market cap, and risk profile. For ServiceNow, this Fair Ratio is 46.0x, suggesting that even after accounting for its strengths and growth potential, the stock trades at nearly double the level that looks justified on these fundamentals.
Result: OVERVALUED
PE ratios tell one story, but what if the real opportunity lies elsewhere? Discover 1459 companies where insiders are betting big on explosive growth.
Upgrade Your Decision Making: Choose your ServiceNow Narrative
Earlier we mentioned that there is an even better way to understand valuation, so let us introduce you to Narratives, an approach that lets you attach a clear story to your numbers by linking what you believe about a company to specific forecasts for its future revenue, earnings, and margins, and then to an explicit Fair Value. A Narrative on Simply Wall St’s Community page is an easy, guided way for millions of investors to set out their assumptions, translate those into a financial forecast, and instantly see whether their Fair Value suggests ServiceNow is a buy, hold, or sell relative to today’s price. Narratives update dynamically as new news or earnings land, so your view on ServiceNow never goes stale. You can quickly see, for example, how one investor’s optimistic Fair Value of about $1,332 compares to another’s more cautious view closer to $904, and decide which story and set of assumptions you find more credible.
Do you think there's more to the story for ServiceNow? Head over to our Community to see what others are saying!

This article by Simply Wall St is general in nature. We provide commentary based on historical data and analyst forecasts only using an unbiased methodology and our articles are not intended to be financial advice. It does not constitute a recommendation to buy or sell any stock, and does not take account of your objectives, or your financial situation. We aim to bring you long-term focused analysis driven by fundamental data. Note that our analysis may not factor in the latest price-sensitive company announcements or qualitative material. Simply Wall St has no position in any stocks mentioned.
Have feedback on this article? Concerned about the content? Get in touch with us directly. Alternatively, email editorial-team@simplywallst.com