
Has Sandisk’s 595% 2025 Surge Left Its Valuation Outrunning Memory Demand Hopes?
- Wondering if Sandisk is still worth buying after its massive run, or if the smart move now is to wait for a better entry point? Let us unpack whether the current price still stacks up to the company’s fundamentals.
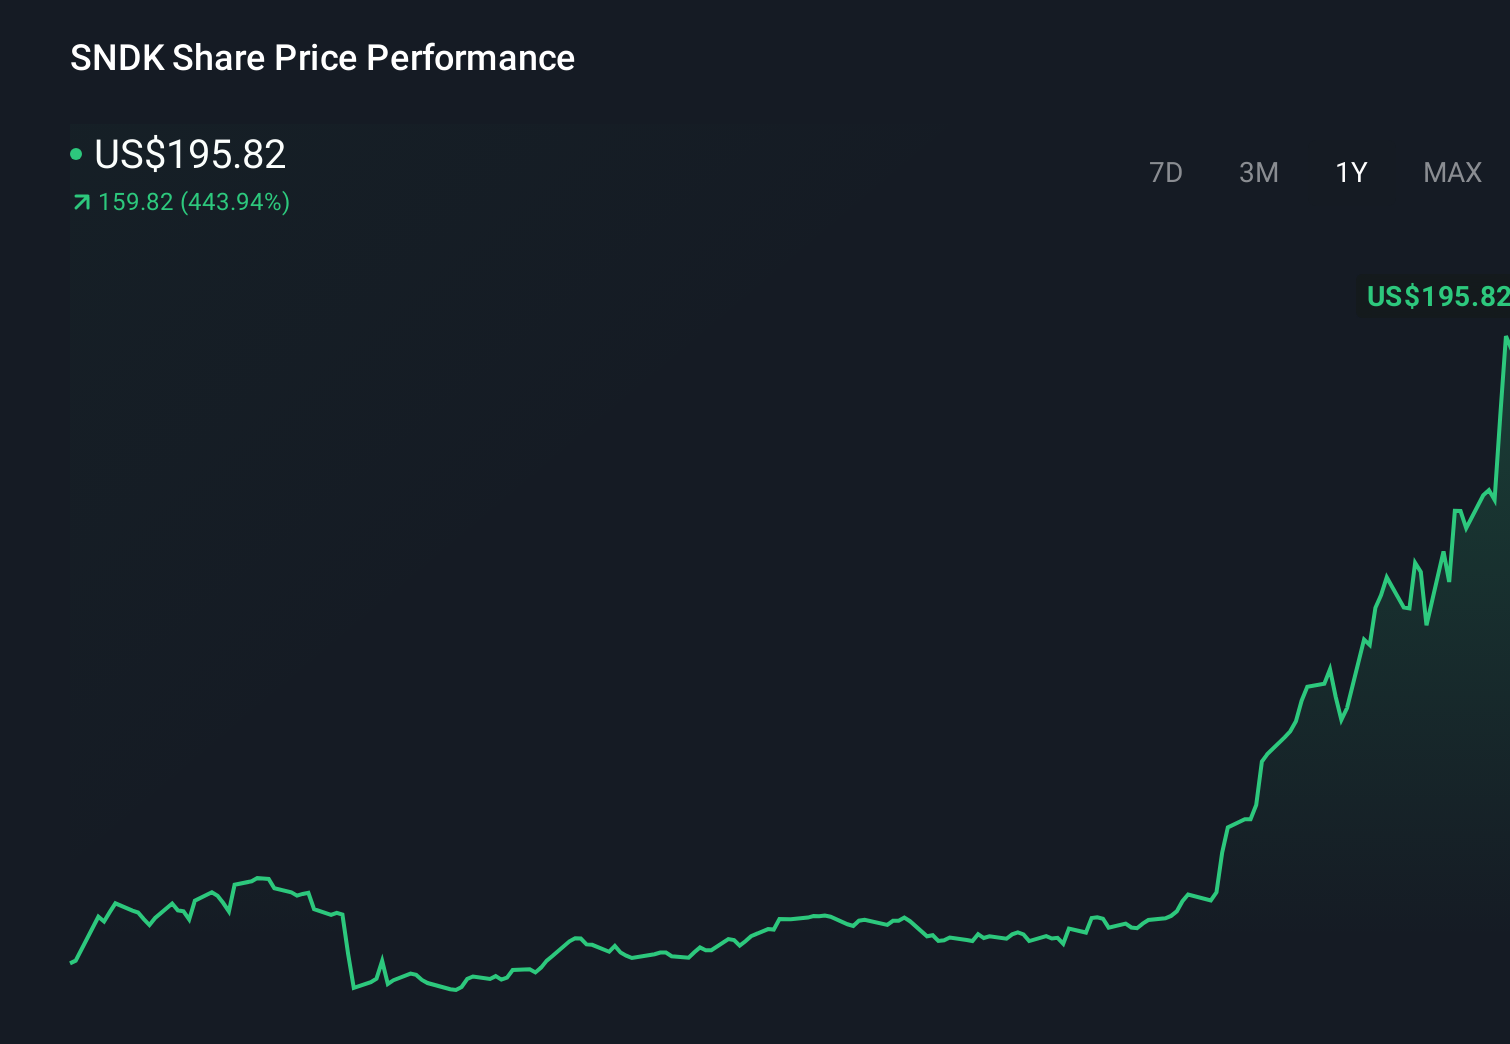
- The stock has surged 20.9% over the last week, 10.2% over the past month, and an eye catching 594.7% year to date, putting it firmly on many investors’ watchlists and significantly changing how the market is pricing its future.
- Recent headlines have focused on Sandisk’s positioning in high demand memory and storage segments, as investors warm to companies that can support AI, cloud infrastructure, and data center growth. In addition, renewed interest in semiconductor names and storage specialists has boosted sentiment toward businesses like Sandisk that stand to benefit from longer term digitalization trends.
- Even after this rally, Sandisk only scores 2 out of 6 on our undervaluation checks. We will walk through what different valuation methods are really saying about the stock today, and then finish with a more holistic way to think about Sandisk’s value beyond the usual models.
Sandisk scores just 2/6 on our valuation checks. See what other red flags we found in the full valuation breakdown.
Approach 1: Sandisk Discounted Cash Flow (DCF) Analysis
A Discounted Cash Flow model estimates what a company is worth by projecting the cash it can generate in the future, then discounting those cash flows back to today in $ terms. For Sandisk, the model starts with last twelve month Free Cash Flow of about $481.4 Million and uses analyst forecasts for the next few years, then extends those trends further out using Simply Wall St’s own extrapolations.
Under this 2 Stage Free Cash Flow to Equity approach, Sandisk’s annual FCF is projected to rise into the low to mid single digit Billions over the coming decade, with estimates such as roughly $1.86 Billion by 2026 and close to $4.69 Billion by 2035, before discounting. When all of these future cash flows are brought back to today, the estimated intrinsic value comes out at around $447.50 per share.
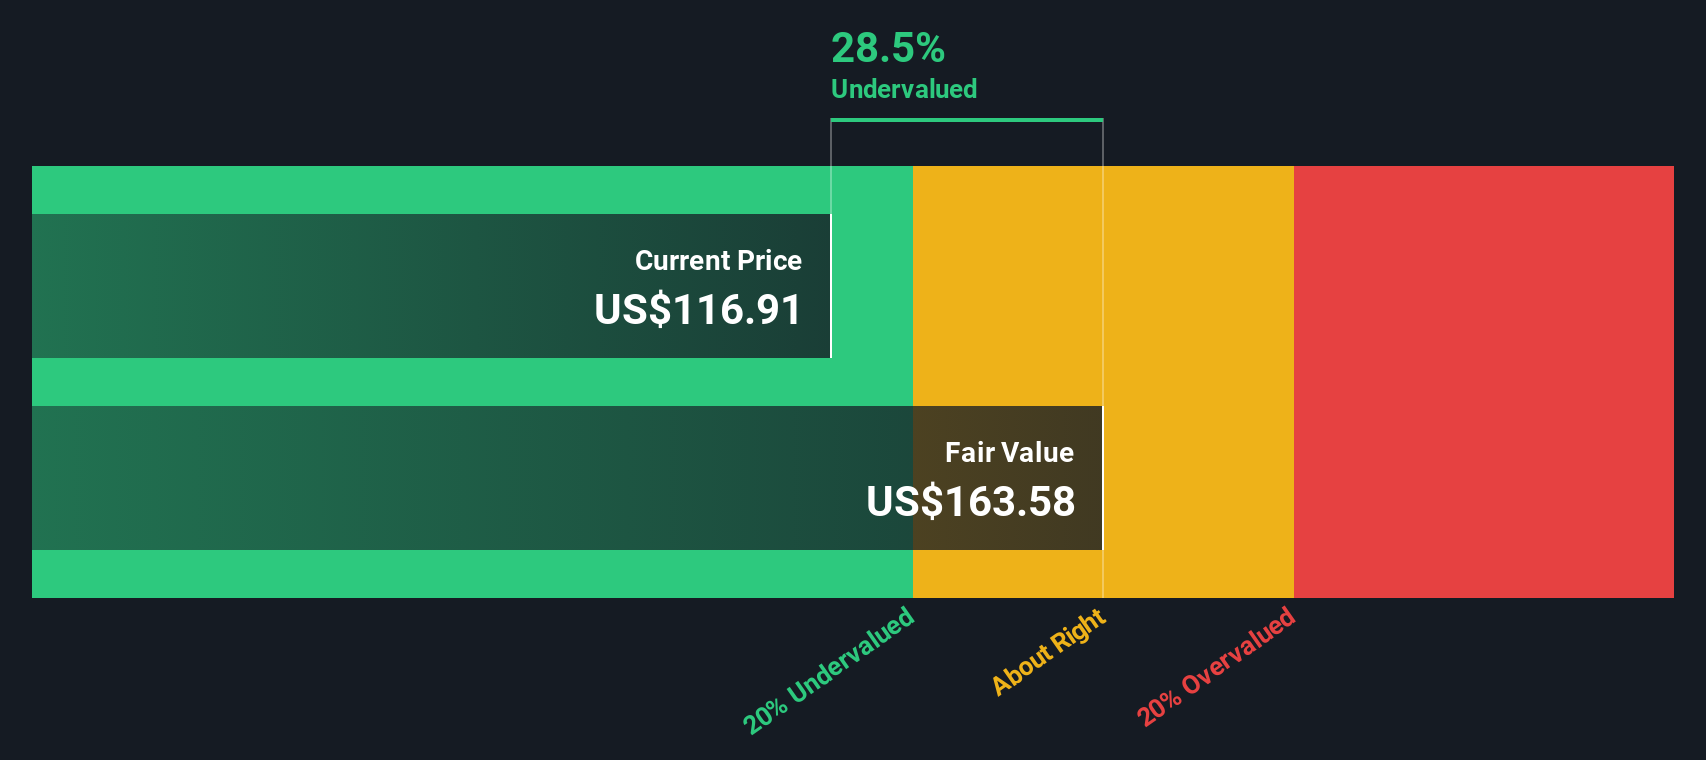
Compared to the current market price, this implies Sandisk trades at a 44.1% discount to its DCF fair value, suggesting the stock looks materially undervalued on this model.
Result: UNDERVALUED
Our Discounted Cash Flow (DCF) analysis suggests Sandisk is undervalued by 44.1%. Track this in your watchlist or portfolio, or discover 905 more undervalued stocks based on cash flows.
Approach 2: Sandisk Price vs Sales
For many technology and semiconductor names, Price to Sales is a useful yardstick because revenue is often more stable and less cyclical than earnings, especially when profits are being reinvested heavily into growth. It gives a cleaner read on how much investors are paying for each dollar of Sandisk’s sales.
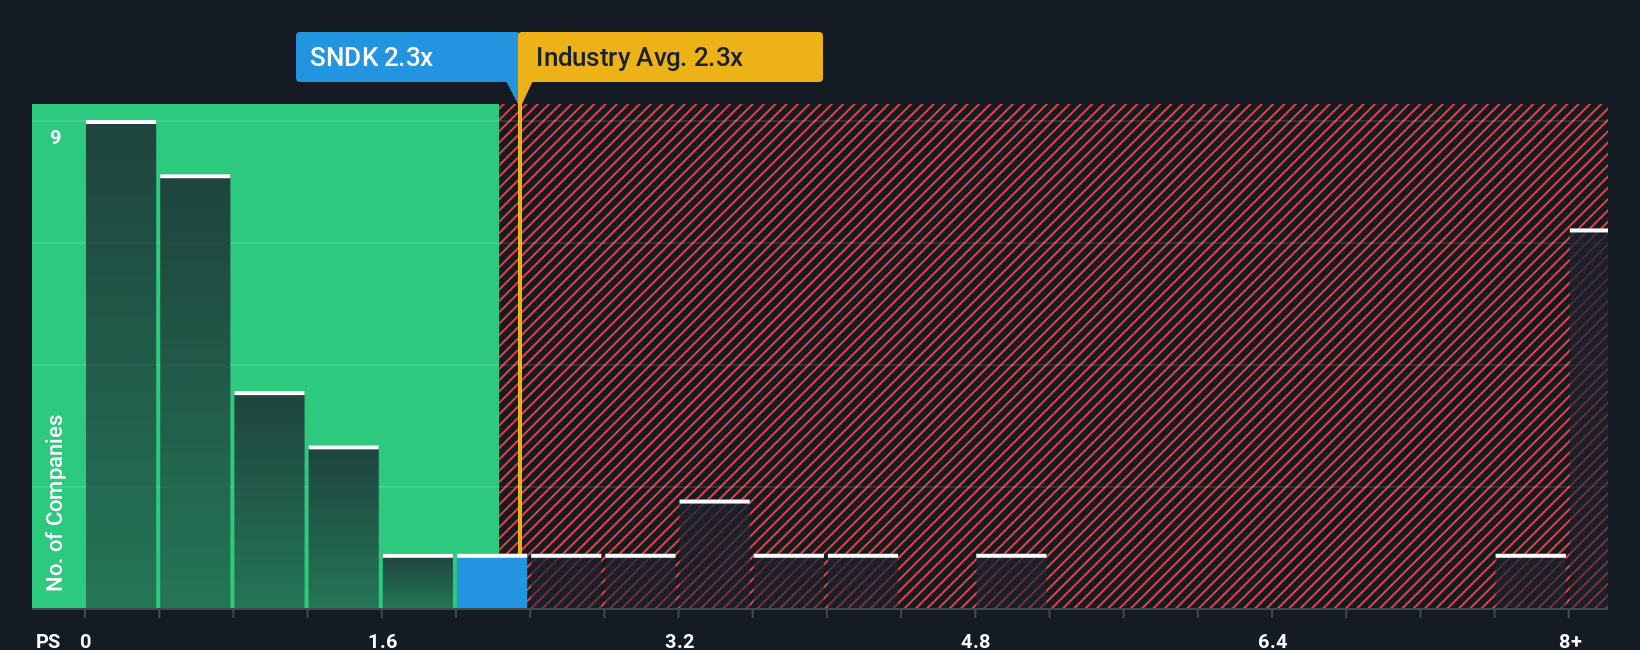
In general, faster growth and lower risk justify a higher Price to Sales multiple, while slower growth, thinner margins or higher uncertainty should drag a “normal” multiple lower. Sandisk currently trades on a Price to Sales ratio of 4.71x. That sits well above the broader Tech industry average of 1.45x and also above its direct peer group average of 2.74x. This implies the market is already assigning Sandisk a growth and quality premium.
Simply Wall St’s Fair Ratio framework refines that comparison by estimating what Sandisk’s Price to Sales ought to be, given its specific growth outlook, profitability profile, risk factors, industry positioning and market cap. On this basis, Sandisk’s Fair Ratio is 3.46x. The current 4.71x therefore looks somewhat rich even after adjusting for its strengths, and the stock is screening as overvalued on a sales multiple basis.
Result: OVERVALUED
PS ratios tell one story, but what if the real opportunity lies elsewhere? Discover 1459 companies where insiders are betting big on explosive growth.
Upgrade Your Decision Making: Choose your Sandisk Narrative
Earlier we mentioned that there is an even better way to understand valuation, so let us introduce you to Narratives, a simple way to connect your view of Sandisk’s future with the numbers behind it. A Narrative is your story about the company, translated into assumptions for future revenue, earnings and margins, which then flow into a financial forecast and ultimately a fair value estimate. On Simply Wall St, millions of investors build these Narratives on the Community page, using easy inputs to link Sandisk’s business drivers to a clear, data backed valuation. Narratives then help you decide how to compare your own view of fair value to today’s market price, and they automatically update as new information like earnings releases or major news arrives. For example, one Sandisk Narrative might assume rapid AI driven demand and lead to a much higher fair value estimate, while another might incorporate slower growth and margin pressure, resulting in a far lower estimate.
Do you think there's more to the story for Sandisk? Head over to our Community to see what others are saying!
This article by Simply Wall St is general in nature. We provide commentary based on historical data and analyst forecasts only using an unbiased methodology and our articles are not intended to be financial advice. It does not constitute a recommendation to buy or sell any stock, and does not take account of your objectives, or your financial situation. We aim to bring you long-term focused analysis driven by fundamental data. Note that our analysis may not factor in the latest price-sensitive company announcements or qualitative material. Simply Wall St has no position in any stocks mentioned.
Have feedback on this article? Concerned about the content? Get in touch with us directly. Alternatively, email editorial-team@simplywallst.com