
- PREMIUM
- LIVE QUOTES
- INSTITUTIONS
 Index Options
 State Street
 CME Group
 Nasdaq
 Cboe
Cboe TradingView
 Wall Street Journal
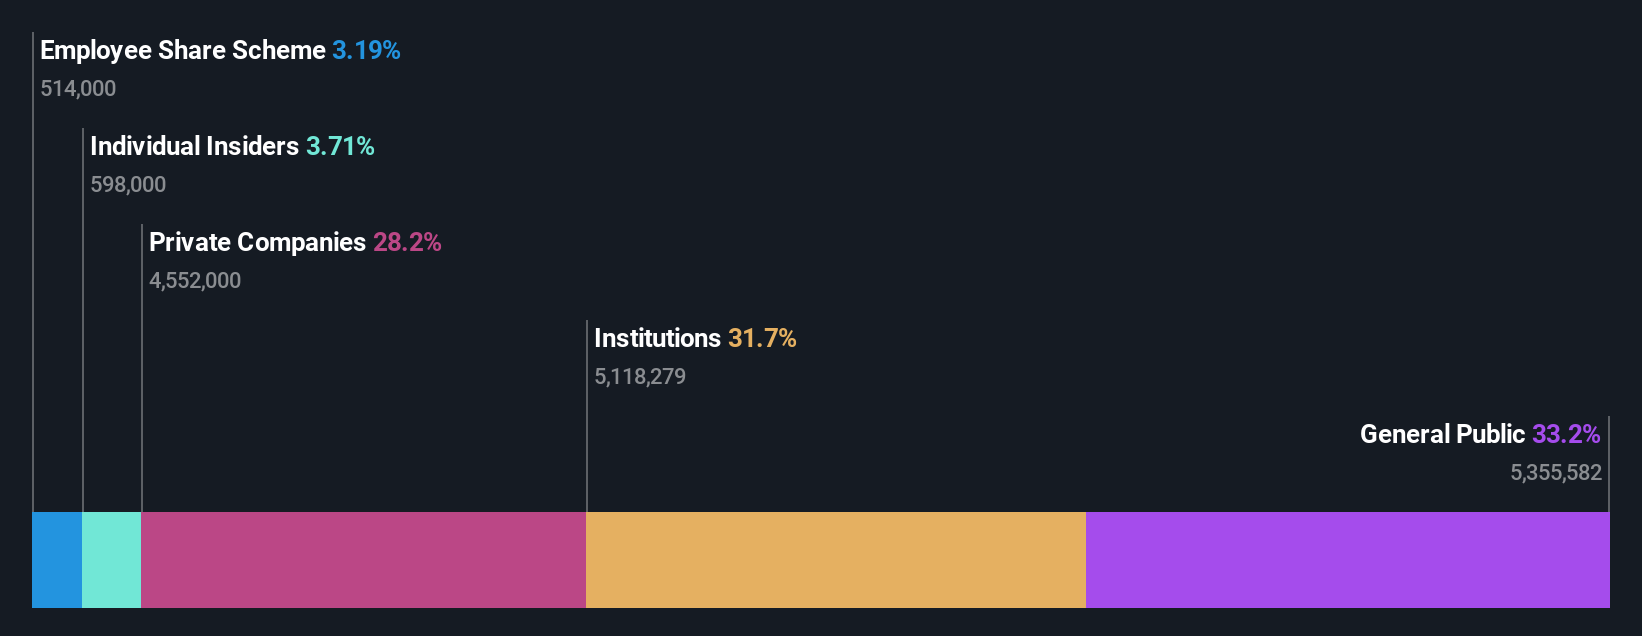
individual investors who own 33% along with institutions invested in C.Uyemura & Co.,Ltd. (TSE:4966) saw increase in their holdings value last week
Key Insights
- The considerable ownership by individual investors in C.UyemuraLtd indicates that they collectively have a greater say in management and business strategy
- 51% of the business is held by the top 6 shareholders
- Institutions own 32% of C.UyemuraLtd
A look at the shareholders of C.Uyemura & Co.,Ltd. (TSE:4966) can tell us which group is most powerful. The group holding the most number of shares in the company, around 33% to be precise, is individual investors. That is, the group stands to benefit the most if the stock rises (or lose the most if there is a downturn).
Individual investors gained the most after market cap touched JP¥241b last week, while institutions who own 32% also benefitted.
Let's delve deeper into each type of owner of C.UyemuraLtd, beginning with the chart below.
Check out our latest analysis for C.UyemuraLtd
What Does The Institutional Ownership Tell Us About C.UyemuraLtd?
Institutional investors commonly compare their own returns to the returns of a commonly followed index. So they generally do consider buying larger companies that are included in the relevant benchmark index.
We can see that C.UyemuraLtd does have institutional investors; and they hold a good portion of the company's stock. This implies the analysts working for those institutions have looked at the stock and they like it. But just like anyone else, they could be wrong. If multiple institutions change their view on a stock at the same time, you could see the share price drop fast. It's therefore worth looking at C.UyemuraLtd's earnings history below. Of course, the future is what really matters.

C.UyemuraLtd is not owned by hedge funds. Naniwa Shokusan Co., Ltd. is currently the company's largest shareholder with 28% of shares outstanding. FMR LLC is the second largest shareholder owning 8.9% of common stock, and MUFG Bank, Ltd. holds about 4.4% of the company stock. Furthermore, CEO Hiroya Uemura is the owner of 1.3% of the company's shares.
On further inspection, we found that more than half the company's shares are owned by the top 6 shareholders, suggesting that the interests of the larger shareholders are balanced out to an extent by the smaller ones.
While studying institutional ownership for a company can add value to your research, it is also a good practice to research analyst recommendations to get a deeper understand of a stock's expected performance. Quite a few analysts cover the stock, so you could look into forecast growth quite easily.
Insider Ownership Of C.UyemuraLtd
The definition of company insiders can be subjective and does vary between jurisdictions. Our data reflects individual insiders, capturing board members at the very least. The company management answer to the board and the latter should represent the interests of shareholders. Notably, sometimes top-level managers are on the board themselves.
Most consider insider ownership a positive because it can indicate the board is well aligned with other shareholders. However, on some occasions too much power is concentrated within this group.
We can see that insiders own shares in C.Uyemura & Co.,Ltd.. This is a big company, so it is good to see this level of alignment. Insiders own JP¥8.9b worth of shares (at current prices). It is good to see this level of investment by insiders. You can check here to see if those insiders have been buying recently.
General Public Ownership
With a 33% ownership, the general public, mostly comprising of individual investors, have some degree of sway over C.UyemuraLtd. While this group can't necessarily call the shots, it can certainly have a real influence on how the company is run.
Private Company Ownership
It seems that Private Companies own 28%, of the C.UyemuraLtd stock. It might be worth looking deeper into this. If related parties, such as insiders, have an interest in one of these private companies, that should be disclosed in the annual report. Private companies may also have a strategic interest in the company.
Next Steps:
It's always worth thinking about the different groups who own shares in a company. But to understand C.UyemuraLtd better, we need to consider many other factors.
I like to dive deeper into how a company has performed in the past. You can find historic revenue and earnings in this detailed graph.
If you are like me, you may want to think about whether this company will grow or shrink. Luckily, you can check this free report showing analyst forecasts for its future.
NB: Figures in this article are calculated using data from the last twelve months, which refer to the 12-month period ending on the last date of the month the financial statement is dated. This may not be consistent with full year annual report figures.
Have feedback on this article? Concerned about the content? Get in touch with us directly. Alternatively, email editorial-team (at) simplywallst.com.
This article by Simply Wall St is general in nature. We provide commentary based on historical data and analyst forecasts only using an unbiased methodology and our articles are not intended to be financial advice. It does not constitute a recommendation to buy or sell any stock, and does not take account of your objectives, or your financial situation. We aim to bring you long-term focused analysis driven by fundamental data. Note that our analysis may not factor in the latest price-sensitive company announcements or qualitative material. Simply Wall St has no position in any stocks mentioned.