
- PREMIUM
- LIVE QUOTES
- INSTITUTIONS
 Index Options
 State Street
 CME Group
 Nasdaq
 Cboe
Cboe TradingView
 Wall Street Journal
With 72% ownership, Ryohin Keikaku Co., Ltd. (TSE:7453) boasts of strong institutional backing
Key Insights
- Institutions' substantial holdings in Ryohin Keikaku implies that they have significant influence over the company's share price
- 51% of the business is held by the top 9 shareholders
- Analyst forecasts along with ownership data serve to give a strong idea about prospects for a business
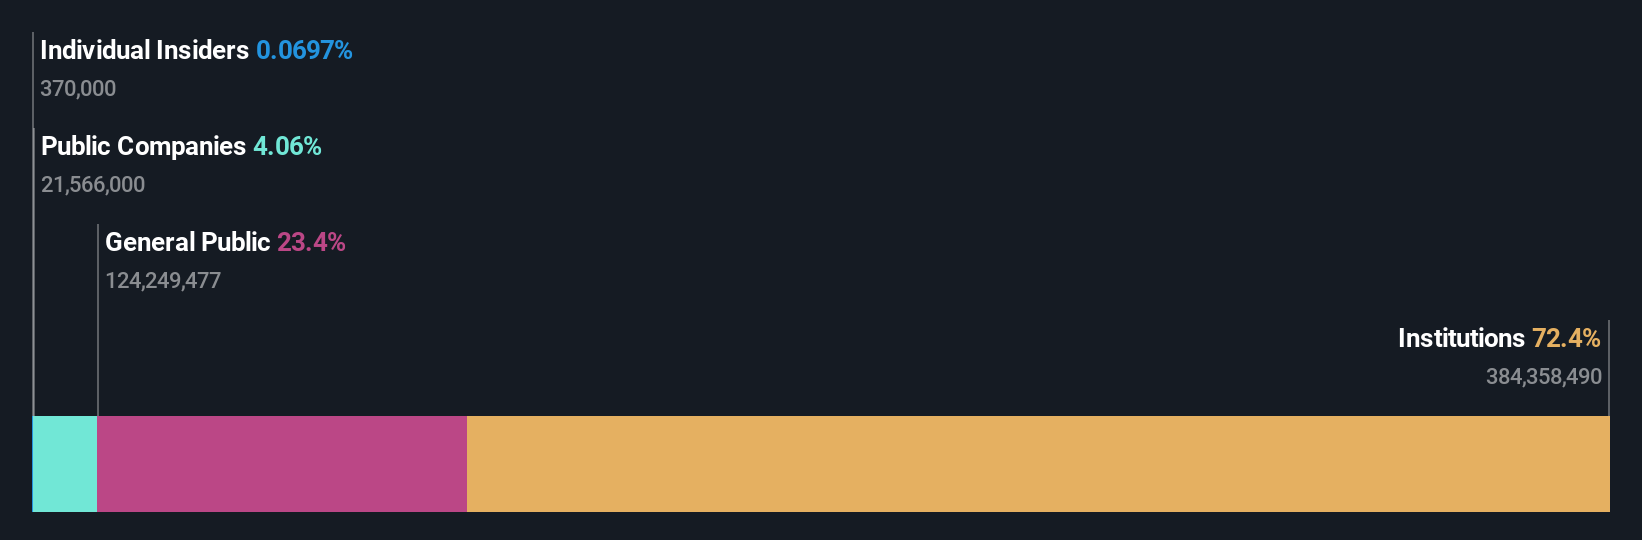
If you want to know who really controls Ryohin Keikaku Co., Ltd. (TSE:7453), then you'll have to look at the makeup of its share registry. The group holding the most number of shares in the company, around 72% to be precise, is institutions. That is, the group stands to benefit the most if the stock rises (or lose the most if there is a downturn).
Because institutional owners have a huge pool of resources and liquidity, their investing decisions tend to carry a great deal of weight, especially with individual investors. As a result, a sizeable amount of institutional money invested in a firm is generally viewed as a positive attribute.
In the chart below, we zoom in on the different ownership groups of Ryohin Keikaku.
View our latest analysis for Ryohin Keikaku
What Does The Institutional Ownership Tell Us About Ryohin Keikaku?
Many institutions measure their performance against an index that approximates the local market. So they usually pay more attention to companies that are included in major indices.
As you can see, institutional investors have a fair amount of stake in Ryohin Keikaku. This suggests some credibility amongst professional investors. But we can't rely on that fact alone since institutions make bad investments sometimes, just like everyone does. If multiple institutions change their view on a stock at the same time, you could see the share price drop fast. It's therefore worth looking at Ryohin Keikaku's earnings history below. Of course, the future is what really matters.

Investors should note that institutions actually own more than half the company, so they can collectively wield significant power. Ryohin Keikaku is not owned by hedge funds. BlackRock, Inc. is currently the largest shareholder, with 13% of shares outstanding. In comparison, the second and third largest shareholders hold about 8.3% and 7.3% of the stock.
We did some more digging and found that 9 of the top shareholders account for roughly 51% of the register, implying that along with larger shareholders, there are a few smaller shareholders, thereby balancing out each others interests somewhat.
Researching institutional ownership is a good way to gauge and filter a stock's expected performance. The same can be achieved by studying analyst sentiments. Quite a few analysts cover the stock, so you could look into forecast growth quite easily.
Insider Ownership Of Ryohin Keikaku
The definition of company insiders can be subjective and does vary between jurisdictions. Our data reflects individual insiders, capturing board members at the very least. The company management answer to the board and the latter should represent the interests of shareholders. Notably, sometimes top-level managers are on the board themselves.
Most consider insider ownership a positive because it can indicate the board is well aligned with other shareholders. However, on some occasions too much power is concentrated within this group.
Our data suggests that insiders own under 1% of Ryohin Keikaku Co., Ltd. in their own names. As it is a large company, we'd only expect insiders to own a small percentage of it. But it's worth noting that they own JP¥1.1b worth of shares. It is good to see board members owning shares, but it might be worth checking if those insiders have been buying.
General Public Ownership
The general public-- including retail investors -- own 23% stake in the company, and hence can't easily be ignored. This size of ownership, while considerable, may not be enough to change company policy if the decision is not in sync with other large shareholders.
Public Company Ownership
Public companies currently own 4.1% of Ryohin Keikaku stock. It's hard to say for sure but this suggests they have entwined business interests. This might be a strategic stake, so it's worth watching this space for changes in ownership.
Next Steps:
It's always worth thinking about the different groups who own shares in a company. But to understand Ryohin Keikaku better, we need to consider many other factors. For example, we've discovered 1 warning sign for Ryohin Keikaku that you should be aware of before investing here.
If you are like me, you may want to think about whether this company will grow or shrink. Luckily, you can check this free report showing analyst forecasts for its future.
NB: Figures in this article are calculated using data from the last twelve months, which refer to the 12-month period ending on the last date of the month the financial statement is dated. This may not be consistent with full year annual report figures.
Have feedback on this article? Concerned about the content? Get in touch with us directly. Alternatively, email editorial-team (at) simplywallst.com.
This article by Simply Wall St is general in nature. We provide commentary based on historical data and analyst forecasts only using an unbiased methodology and our articles are not intended to be financial advice. It does not constitute a recommendation to buy or sell any stock, and does not take account of your objectives, or your financial situation. We aim to bring you long-term focused analysis driven by fundamental data. Note that our analysis may not factor in the latest price-sensitive company announcements or qualitative material. Simply Wall St has no position in any stocks mentioned.