
- PREMIUM
- LIVE QUOTES
- INSTITUTIONS
 Index Options
 State Street
 CME Group
 Nasdaq
 Cboe
Cboe TradingView
 Wall Street Journal
Has Nu Holdings’ Rapid Latin American Expansion Already Been Priced In For 2025?
- If you are wondering whether Nu Holdings is still a smart buy after its run up, or if the easy gains are gone, you are not alone. This article is going to unpack what the current price is really implying.
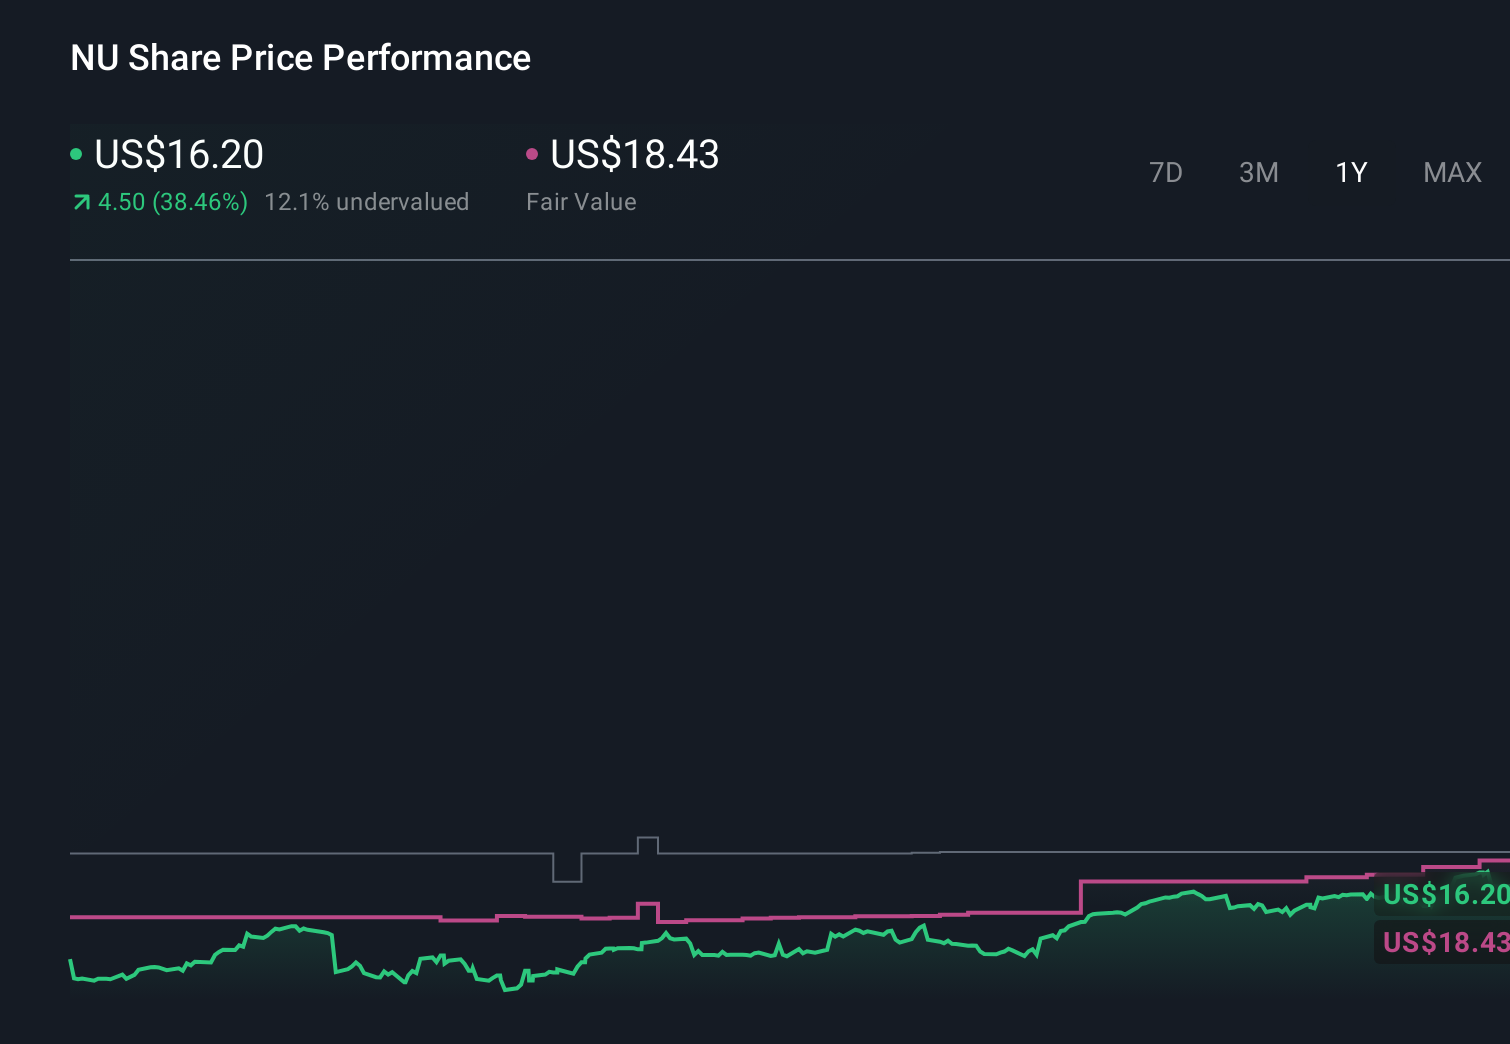
- The stock has cooled slightly over the last week, down about 0.2%, but is still up 4.6% over the last month, 56.4% year to date and 62.3% over the past year, with a 327.2% gain over three years reshaping how investors see its potential.
- Behind those moves is a steady stream of bullish headlines around Nu's rapid user growth in Latin America and its expanding product ecosystem, from digital banking to credit and investment services. Investors have also been reacting to broader fintech optimism in the region and ongoing commentary about Nu's ability to keep winning market share from traditional banks.
- Despite that excitement, Nu scores just 0 out of 6 on our valuation checks, which suggests the market may already be pricing in a lot of good news. Next we will walk through the main valuation approaches that drive that score, and then finish with a more nuanced way to think about Nu's worth beyond the usual metrics.
Nu Holdings scores just 0/6 on our valuation checks. See what other red flags we found in the full valuation breakdown.
Approach 1: Nu Holdings Excess Returns Analysis
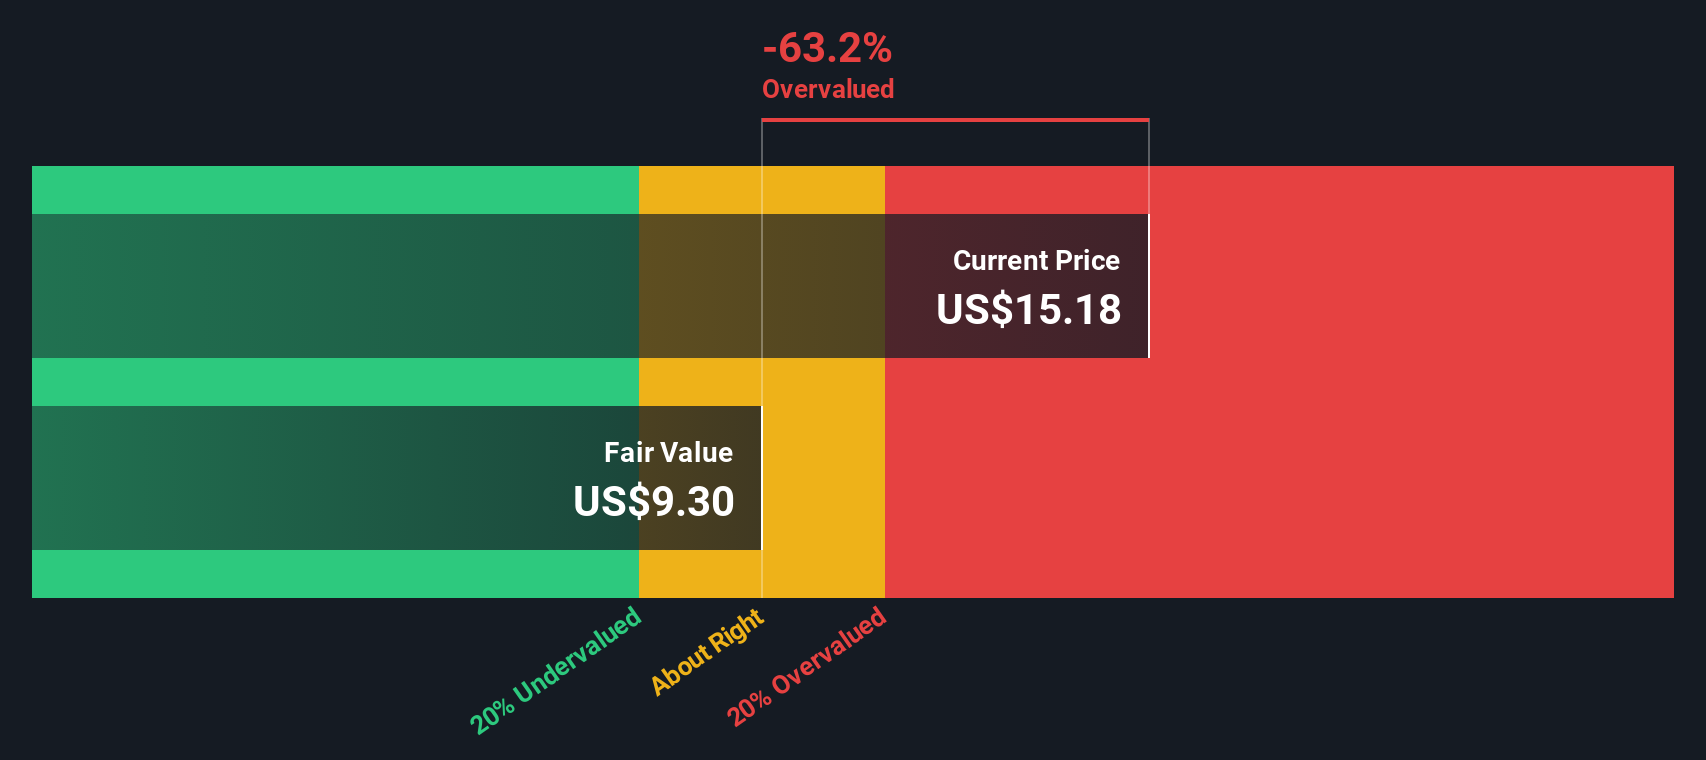
The Excess Returns model looks at how much profit Nu Holdings can generate above the return investors demand on its equity, then capitalizes those surplus profits into an intrinsic value per share.
In Nu's case, the model starts with a Book Value of $2.18 per share and a Stable EPS of $0.99 per share, based on weighted future Return on Equity estimates from 9 analysts. Against a Cost of Equity of $0.38 per share, this implies an Excess Return of $0.61 per share, supported by an Average Return on Equity of 30.70%. Analysts also see Stable Book Value rising to $3.21 per share, using estimates from 6 analysts.
Combining these inputs, the Excess Returns framework produces an intrinsic value of about $10.41 per share. With the model indicating that the stock is roughly 59.6% above the current market price, the analysis suggests that investors are paying a steep premium for Nu's growth and profitability.
Result: OVERVALUED
Our Excess Returns analysis suggests Nu Holdings may be overvalued by 59.6%. Discover 907 undervalued stocks or create your own screener to find better value opportunities.
Approach 2: Nu Holdings Price vs Earnings
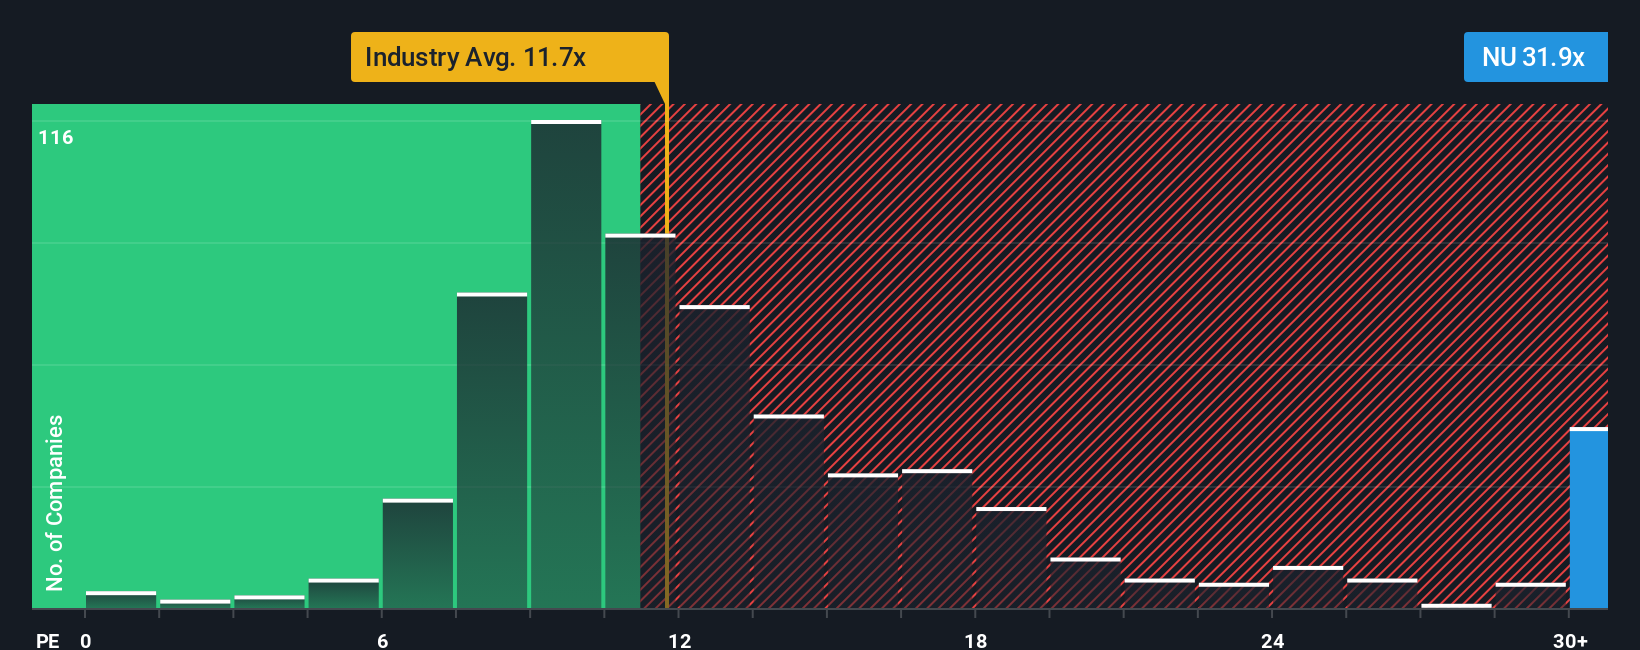
For a profitable business like Nu Holdings, the price to earnings (PE) ratio is a useful way to gauge what investors are willing to pay for each dollar of current earnings. In general, faster growth and lower perceived risk justify a higher PE, while slower growth or higher risk should mean a lower, more conservative multiple.
Nu currently trades on a PE of about 31.8x, which stands well above the Banks industry average of roughly 11.9x and also ahead of the peer group average of about 13.0x. On the surface, that gap suggests the market is already pricing in very strong growth and durable competitive advantages.
Simply Wall St’s Fair Ratio framework goes a step further by estimating what PE multiple Nu should trade on given its specific earnings growth outlook, profitability, risk profile, industry and market cap. For Nu, this Fair Ratio is 22.5x, which is notably below the current market multiple. Because this approach adjusts for Nu’s strengths and risk factors rather than relying only on broad industry or peer comparisons, it offers a more tailored benchmark. With the actual PE multiple sitting materially above the Fair Ratio, Nu screens as being overvalued on a PE basis.
Result: OVERVALUED
PE ratios tell one story, but what if the real opportunity lies elsewhere? Discover 1456 companies where insiders are betting big on explosive growth.
Upgrade Your Decision Making: Choose your Nu Holdings Narrative
Earlier we mentioned that there is an even better way to understand valuation, so let us introduce you to Narratives, a simple way to connect the story you believe about Nu Holdings with a concrete financial forecast and a Fair Value you can compare to today’s price. On Simply Wall St’s Community page, Narratives let you spell out your assumptions for Nu’s future revenue, earnings and margins, then automatically turn those inputs into a forecast and valuation, so you can quickly see how your view compares to the current market price. Because Narratives update dynamically when new information, like earnings or major news about Nu’s US bank charter or Mexican expansion, is released, your Fair Value stays in sync with reality rather than a static spreadsheet. For example, one investor might build a Narrative that assumes earnings move toward the higher end of analyst expectations and supports a Fair Value near the top of the current target range around $20 per share, while a more cautious investor may project slower growth, tighter margins and a Fair Value closer to the low end, around $14 per share.
Do you think there's more to the story for Nu Holdings? Head over to our Community to see what others are saying!
This article by Simply Wall St is general in nature. We provide commentary based on historical data and analyst forecasts only using an unbiased methodology and our articles are not intended to be financial advice. It does not constitute a recommendation to buy or sell any stock, and does not take account of your objectives, or your financial situation. We aim to bring you long-term focused analysis driven by fundamental data. Note that our analysis may not factor in the latest price-sensitive company announcements or qualitative material. Simply Wall St has no position in any stocks mentioned.
Have feedback on this article? Concerned about the content? Get in touch with us directly. Alternatively, email editorial-team@simplywallst.com