
- PREMIUM
- LIVE QUOTES
- INSTITUTIONS
 Index Options
 State Street
 CME Group
 Nasdaq
 Cboe
Cboe TradingView
 Wall Street Journal
Lifenet Insurance (TSE:7157): Valuation Check After Solid Growth in Monthly Premiums
Premium growth gives investors fresh data point
Lifenet Insurance (TSE:7157) just posted its November 2025 premium figures, showing steady year on year growth in both individual and group credit life policies, giving investors another data point on operating momentum.
See our latest analysis for Lifenet Insurance.
The latest premium update lands after a choppy few months, with a 5.02 percent 7 day share price return and a 10.52 percent year to date share price gain contrasting with a modest 1.50 percent 1 year total shareholder return. This suggests momentum is picking up again, even if longer term holders have seen more muted progress than the standout 69.69 percent 3 year total shareholder return.
If this steady improvement in premiums has you thinking about where else growth and sentiment might be shifting, it could be worth exploring fast growing stocks with high insider ownership as your next idea source.
With premiums climbing and the share price edging closer to analyst targets, the key question now is whether Lifenet Insurance still trades below its intrinsic value or if the market is already pricing in future growth.
Price-to-Earnings of 21.6x: Is it justified?
Lifenet Insurance currently trades on a price to earnings ratio of 21.6 times, which points to an expensive valuation versus both peers and intrinsic value at the ¥1,965 last close.
The price to earnings multiple measures how much investors are willing to pay today for each unit of current earnings, a key benchmark for insurance stocks where profit visibility and capital efficiency matter. A higher multiple often reflects expectations of superior earnings growth or quality, but it can also indicate that optimism is running ahead of fundamentals.
In Lifenet Insurance's case, the 21.6 times price to earnings ratio stands well above the Asian insurance industry average of 11.4 times and the peer average of 12.4 times, suggesting the market is paying a significant premium for its earnings. This premium also exceeds the estimated fair price to earnings ratio of 12.4 times, implying that if sentiment normalises towards this level, there is room for the valuation multiple to compress rather than expand.
Explore the SWS fair ratio for Lifenet Insurance
Result: Price-to-Earnings of 21.6x (OVERVALUED)
However, investors should watch for earnings disappointments or slower premium growth, which could quickly deflate sentiment and trigger a valuation de-rating.
Find out about the key risks to this Lifenet Insurance narrative.
Another View: Our DCF Suggests a Different Story
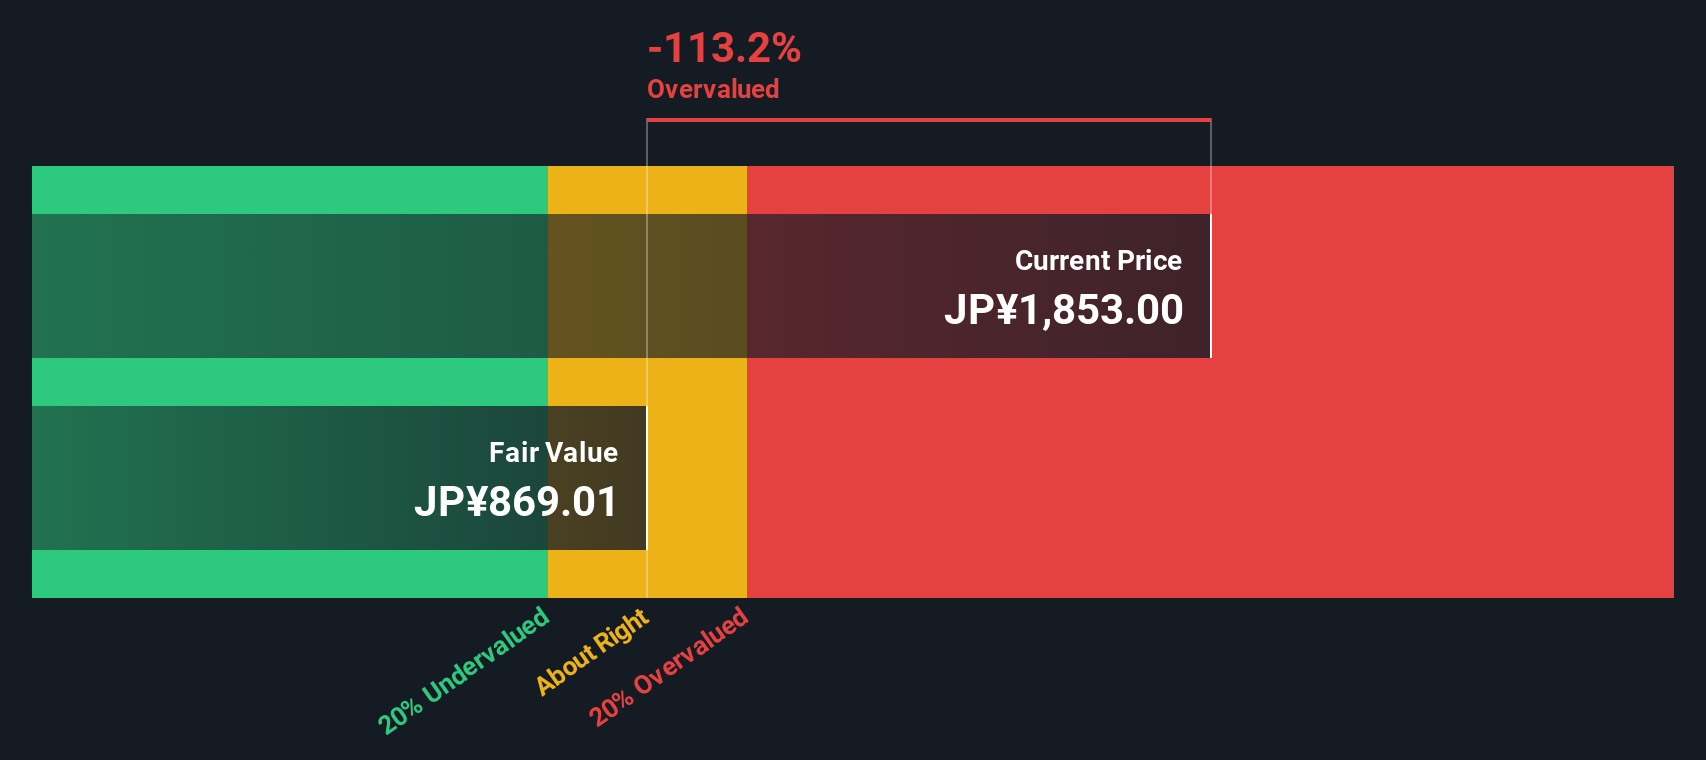
While the price to earnings ratio makes Lifenet Insurance look expensive, our DCF model is less harsh, putting fair value at about ¥1,849 per share versus the current ¥1,965. That suggests only modest overvaluation and raises the question: is this a small premium for quality or the start of a bigger disconnect?
Look into how the SWS DCF model arrives at its fair value.
Simply Wall St performs a discounted cash flow (DCF) on every stock in the world every day (check out Lifenet Insurance for example). We show the entire calculation in full. You can track the result in your watchlist or portfolio and be alerted when this changes, or use our stock screener to discover 902 undervalued stocks based on their cash flows. If you save a screener we even alert you when new companies match - so you never miss a potential opportunity.
Build Your Own Lifenet Insurance Narrative
If you see the numbers differently or want to dig into the details yourself, you can build a personalised view in just a few minutes: Do it your way.
A good starting point is our analysis highlighting 2 key rewards investors are optimistic about regarding Lifenet Insurance.
Looking for more investment ideas?
Do not stop at a single opportunity. Use the Simply Wall Street Screener today to target fresh, data backed stock ideas that others might overlook entirely.
- Capture the upside of smaller companies with improving fundamentals by reviewing these 3633 penny stocks with strong financials that already show financial strength beneath the radar.
- Ride the structural shift toward automation and intelligent software by focusing on these 24 AI penny stocks positioned at the heart of AI driven growth.
- Lock in quality at compelling prices by scanning these 902 undervalued stocks based on cash flows that trade below what their cash flows suggest they are truly worth.
This article by Simply Wall St is general in nature. We provide commentary based on historical data and analyst forecasts only using an unbiased methodology and our articles are not intended to be financial advice. It does not constitute a recommendation to buy or sell any stock, and does not take account of your objectives, or your financial situation. We aim to bring you long-term focused analysis driven by fundamental data. Note that our analysis may not factor in the latest price-sensitive company announcements or qualitative material. Simply Wall St has no position in any stocks mentioned.
Have feedback on this article? Concerned about the content? Get in touch with us directly. Alternatively, email editorial-team@simplywallst.com