
- PREMIUM
- LIVE QUOTES
- INSTITUTIONS
 Index Options
 State Street
 CME Group
 Nasdaq
 Cboe
Cboe TradingView
 Wall Street Journal
Is It Too Late To Consider Alibaba After Its 77% Rebound And Regulatory Easing?
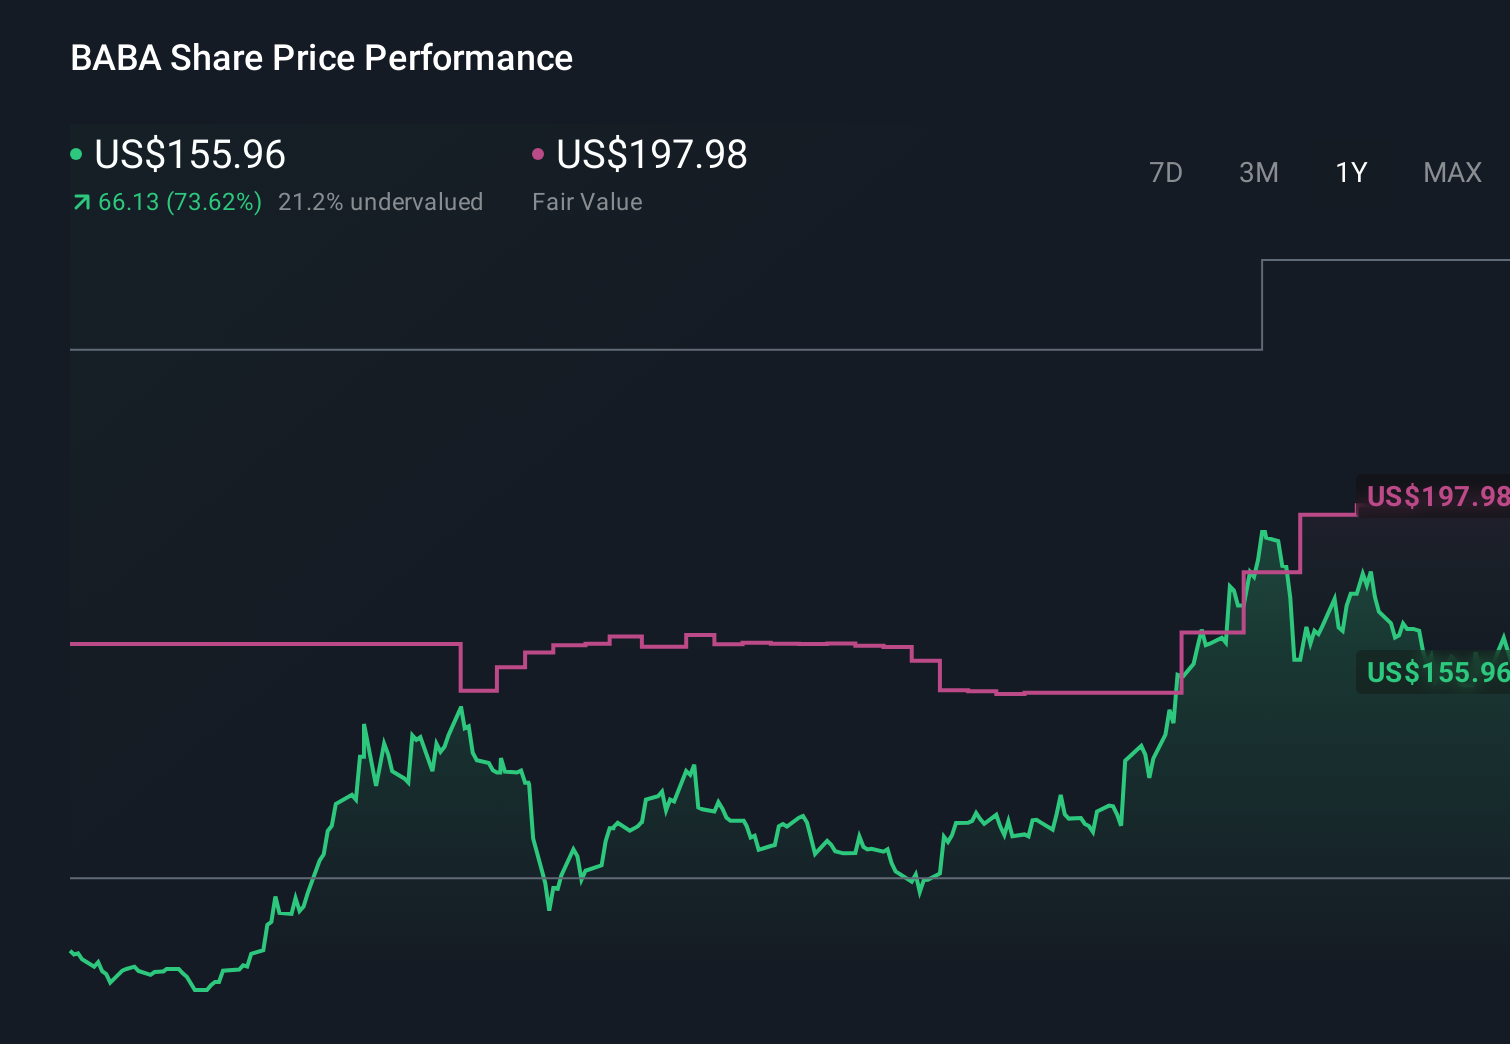
- If you are wondering whether Alibaba Group Holding is still a bargain after its big rebound, or if you have already missed the boat, you are in the right place to unpack what the current price really implies.
- The stock has climbed 77.7% year to date and 80.3% over the last year, even though the 5 year return is still down 28.6%. This combination points to shifting market expectations and a possible rerating story in progress.
- Much of this renewed interest has been driven by Beijing easing its regulatory pressure on major tech platforms, along with ongoing headlines about Alibaba simplifying its sprawling structure and sharpening its focus on core e commerce and cloud operations. Investors have also been watching leadership changes and strategic spin off plans as signals that management is focused on unlocking trapped value.
- On our checklist of six core valuation tests, Alibaba scores a 6 out of 6, suggesting it appears undervalued across multiple lenses. Next, we will walk through those methods, before exploring another way to think about what this valuation means for long term investors.
Approach 1: Alibaba Group Holding Discounted Cash Flow (DCF) Analysis
The Discounted Cash Flow model estimates what a business is worth by projecting the cash it can generate in the future and then discounting those cash flows back to today. For Alibaba Group Holding, this 2 Stage Free Cash Flow to Equity model starts from its latest twelve month free cash flow of roughly CN¥50.9 billion and builds forward.
Analysts provide detailed forecasts for the next few years. Beyond that point, Simply Wall St extrapolates growth based on recent trends. On this basis, Alibaba Group Holding's free cash flow is projected to reach about CN¥406.5 billion in ten years, implying a substantial expansion of its cash generating ability over time. When all these future cash flows are discounted back, the model arrives at an intrinsic value of roughly $266.98 per share.
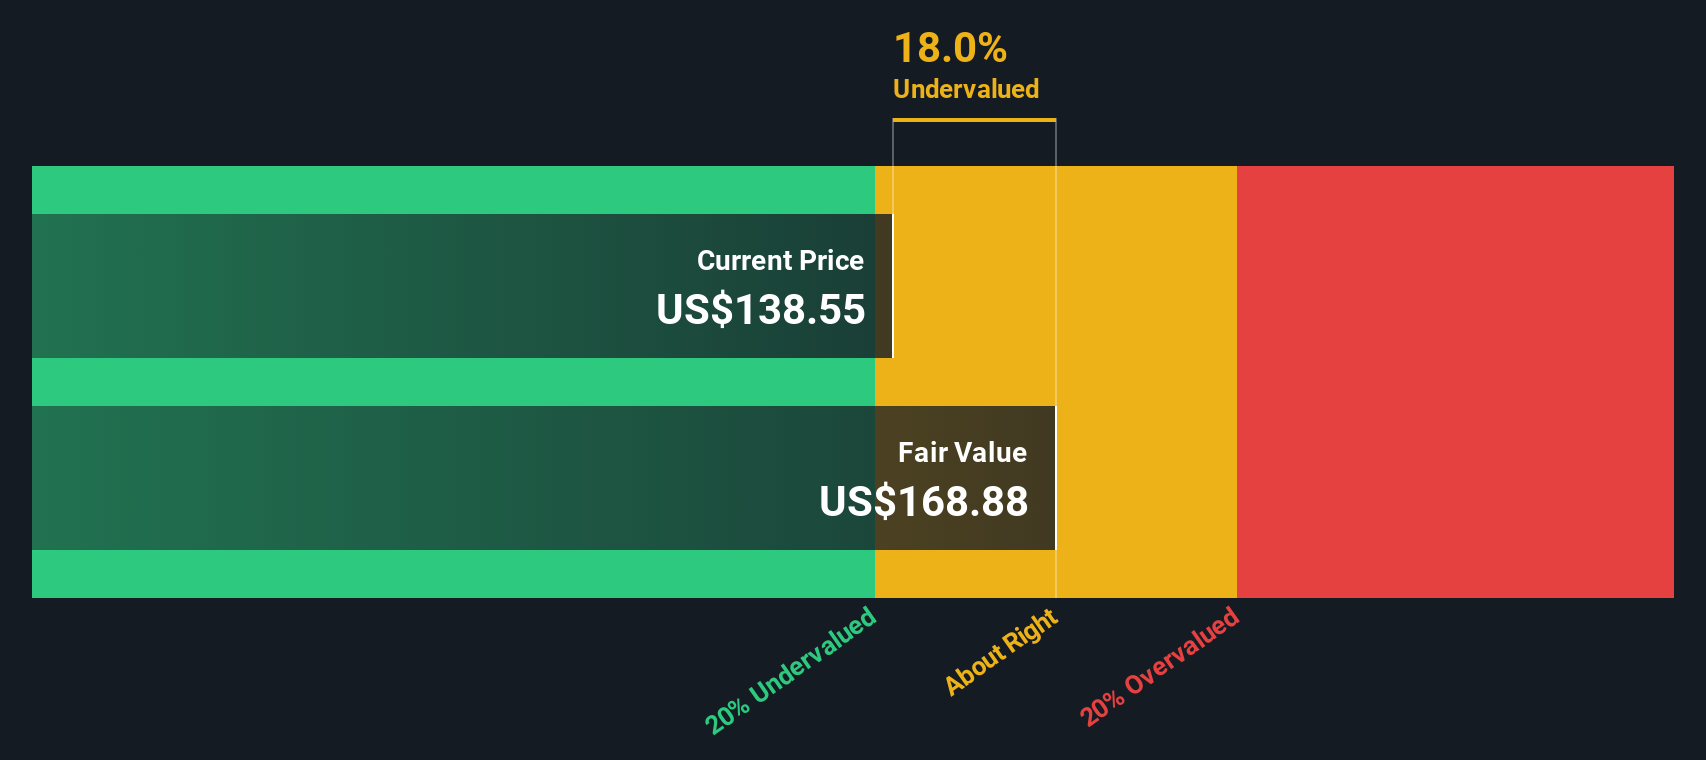
Compared with the current share price, this implies Alibaba Group Holding is trading at about a 43.5% discount to its estimated fair value. This suggests the market is still cautious relative to the underlying cash flow outlook.
Result: UNDERVALUED
Our Discounted Cash Flow (DCF) analysis suggests Alibaba Group Holding is undervalued by 43.5%. Track this in your watchlist or portfolio, or discover 901 more undervalued stocks based on cash flows.
Approach 2: Alibaba Group Holding Price vs Earnings
For profitable companies like Alibaba Group Holding, the price to earnings ratio is a useful yardstick because it links what investors pay today to the profits the business is already generating. A higher PE ratio can be justified when a company is expected to grow earnings quickly and has relatively low perceived risk, while slower growth or higher uncertainty usually warrant a lower, more conservative multiple.
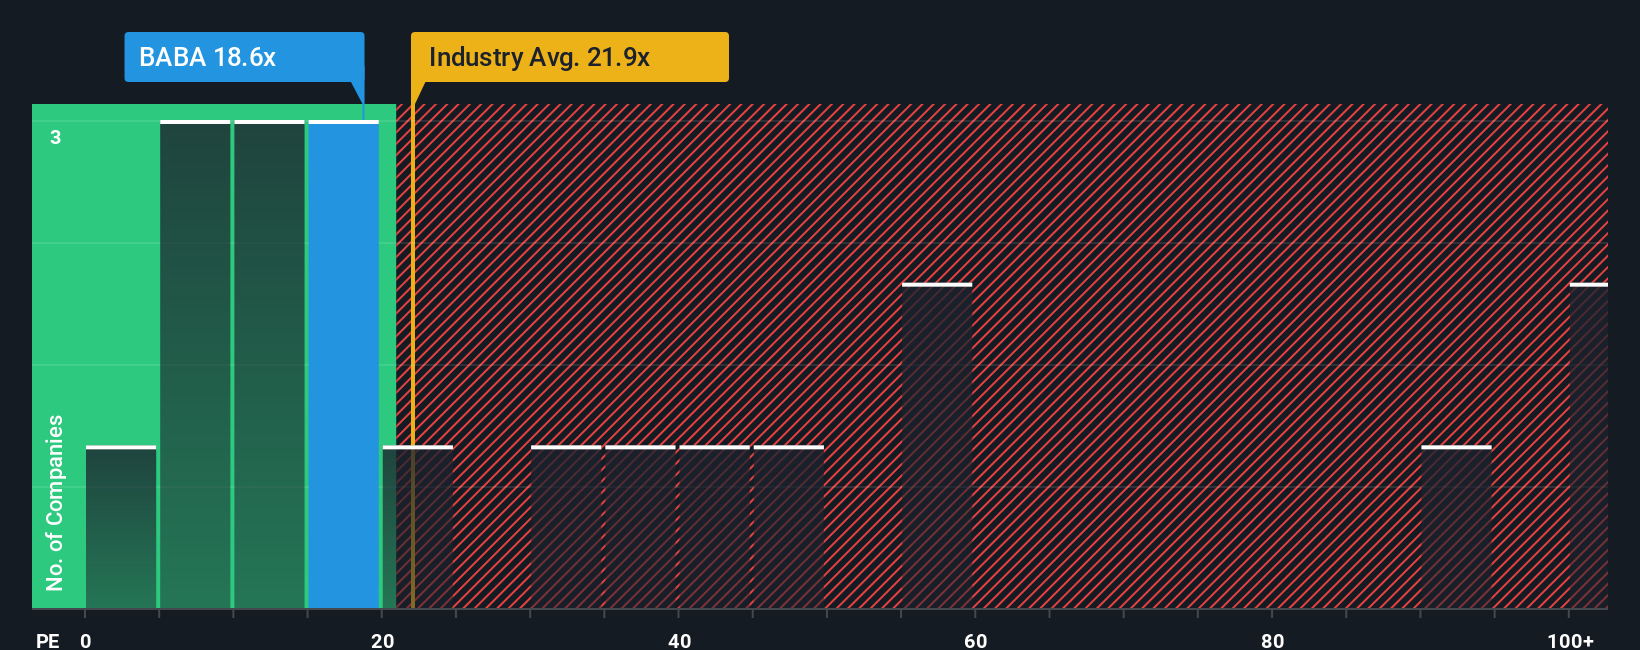
Alibaba currently trades on a PE of about 18.9x, which is slightly below the Multiline Retail industry average of roughly 19.5x and well below the broader peer group average of around 35.9x. Simply Wall St also calculates a proprietary Fair Ratio of 30.5x for Alibaba, which is the PE level that would be expected given its specific mix of earnings growth potential, margins, industry positioning, market cap and risk profile. This Fair Ratio is more tailored than a simple comparison with peers or the sector, because it adjusts for Alibaba's own fundamentals rather than assuming all companies deserve the same multiple.
Since Alibaba's actual PE of 18.9x sits meaningfully below the 30.5x Fair Ratio, the shares appear attractively priced on an earnings basis.
Result: UNDERVALUED
PE ratios tell one story, but what if the real opportunity lies elsewhere? Discover 1459 companies where insiders are betting big on explosive growth.
Upgrade Your Decision Making: Choose your Alibaba Group Holding Narrative
Earlier we mentioned that there is an even better way to understand valuation, so let us introduce you to Narratives, a simple way to connect your view of Alibaba Group Holding's business to a set of numbers like future revenue, earnings, margins and an implied fair value per share.
A Narrative is your story about a company, translated into a financial forecast that projects how the business might grow, what its profitability could look like and what those assumptions suggest the stock is actually worth today.
On Simply Wall St, Narratives live in the Community page and are easy to use. They let you compare your Fair Value for Alibaba Group Holding with the current market price to decide whether it looks like a buy, a hold or a sell, while automatically updating as new information such as earnings, guidance or major news is released.
For example, one Alibaba Group Holding Narrative on the platform currently implies a fair value of about $107 per share based on more cautious growth and margin expectations. Another more optimistic Narrative points to a fair value closer to $198, illustrating how different investors can apply the same framework to very different stories and decisions.
For Alibaba Group Holding however we will make it really easy for you with previews of two leading Alibaba Group Holding Narratives:
🐂 Alibaba Group Holding Bull Case
Fair value: $198.04 per share
Implied undervaluation vs last close: 23.8%
Assumed annual revenue growth: 9.34%
- Views Alibaba's RMB 380 billion AI and cloud investment as a long term growth engine and expects it to support stronger earnings power despite near term margin pressure.
- Expects integrated e commerce, cloud, quick commerce and loyalty programs to deepen user engagement, raise monetization and lift margins over time.
- Aligns with a consensus price target around $162, with bullish scenarios above $190, assuming earnings reach CN¥171.1 billion by 2028 and the stock commands a higher PE multiple.
🐻 Alibaba Group Holding Bear Case
Fair value: $107.09 per share
Implied overvaluation vs last close: 41.0%
Assumed annual revenue growth: 14.12%
- Uses a DCF based on $15 billion in normalized free cash flow, a 9.4% cost of equity and 8% fading to 2.5% long run growth to arrive at a fair value of $107.09 per share.
- Argues that at current levels the stock already prices in strong AI and cloud momentum, leaving limited upside given regulatory, macro and geopolitical risks.
- Highlights US China trade tensions, ongoing regulation of Chinese tech, fierce cloud and AI competition and currency risk as key downside factors even as operations remain solid.
Do you think there's more to the story for Alibaba Group Holding? Head over to our Community to see what others are saying!
This article by Simply Wall St is general in nature. We provide commentary based on historical data and analyst forecasts only using an unbiased methodology and our articles are not intended to be financial advice. It does not constitute a recommendation to buy or sell any stock, and does not take account of your objectives, or your financial situation. We aim to bring you long-term focused analysis driven by fundamental data. Note that our analysis may not factor in the latest price-sensitive company announcements or qualitative material. Simply Wall St has no position in any stocks mentioned.
Have feedback on this article? Concerned about the content? Get in touch with us directly. Alternatively, email editorial-team@simplywallst.com