
- PREMIUM
- LIVE QUOTES
- INSTITUTIONS
 Index Options
 State Street
 CME Group
 Nasdaq
 Cboe
Cboe TradingView
 Wall Street Journal
Does EQT’s Recent Share Price Rally Still Reflect Its Long Term Prospects?
- If you are wondering whether EQT is still worth buying after its big run, you are not alone. This article will unpack what the current share price really implies.
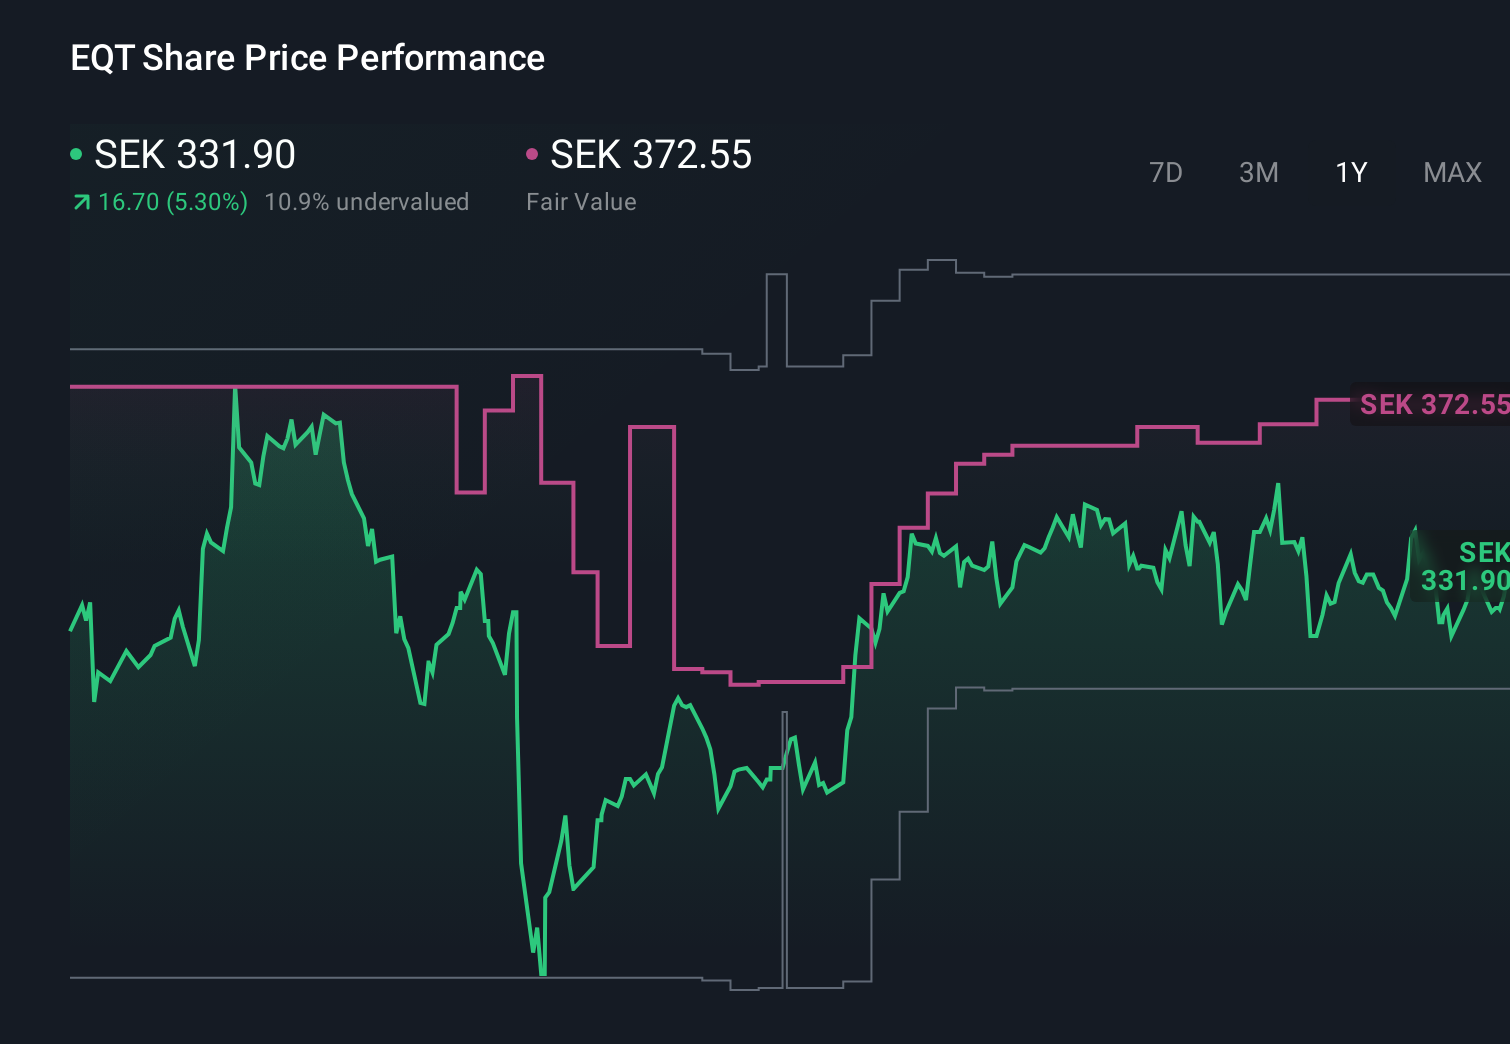
- The stock has climbed 6.1% over the last week, 13.9% over the past month, and is now up 19.9% over the last year, building on a 70.2% gain over three years.
- Investors have been reacting to a stream of strategic updates and deal activity that signal how EQT is positioning itself in a shifting private markets landscape. Recent announcements around new fund launches, capital-raising progress, and portfolio developments have all helped shape sentiment around the stock's growth prospects and risk profile.
- Despite this strong track record, EQT currently scores just 0/6 on our valuation checks. This may surprise anyone expecting the fundamentals to fully support the price. We will walk through different valuation approaches next and finish by exploring an intuitive way to judge whether the market is getting this story right.
EQT scores just 0/6 on our valuation checks. See what other red flags we found in the full valuation breakdown.
Approach 1: EQT Excess Returns Analysis
The Excess Returns model looks at how much profit EQT can generate above the return that investors demand on its equity, then capitalises those surplus profits into an intrinsic value per share.
For EQT, the model starts from a Book Value of SEK6.21 per share and a Stable EPS of SEK1.53 per share, based on weighted future Return on Equity estimates from 9 analysts. With an Average Return on Equity of 20.83%, the business is expected to earn comfortably more than its Cost of Equity of SEK0.46 per share. That gap, the Excess Return, is estimated at SEK1.07 per share.
Over time, analysts expect the Stable Book Value to rise to SEK7.34 per share, supported by forecasts from 6 analysts. Combining this growing equity base with returns above the required rate is what drives the Excess Returns valuation.
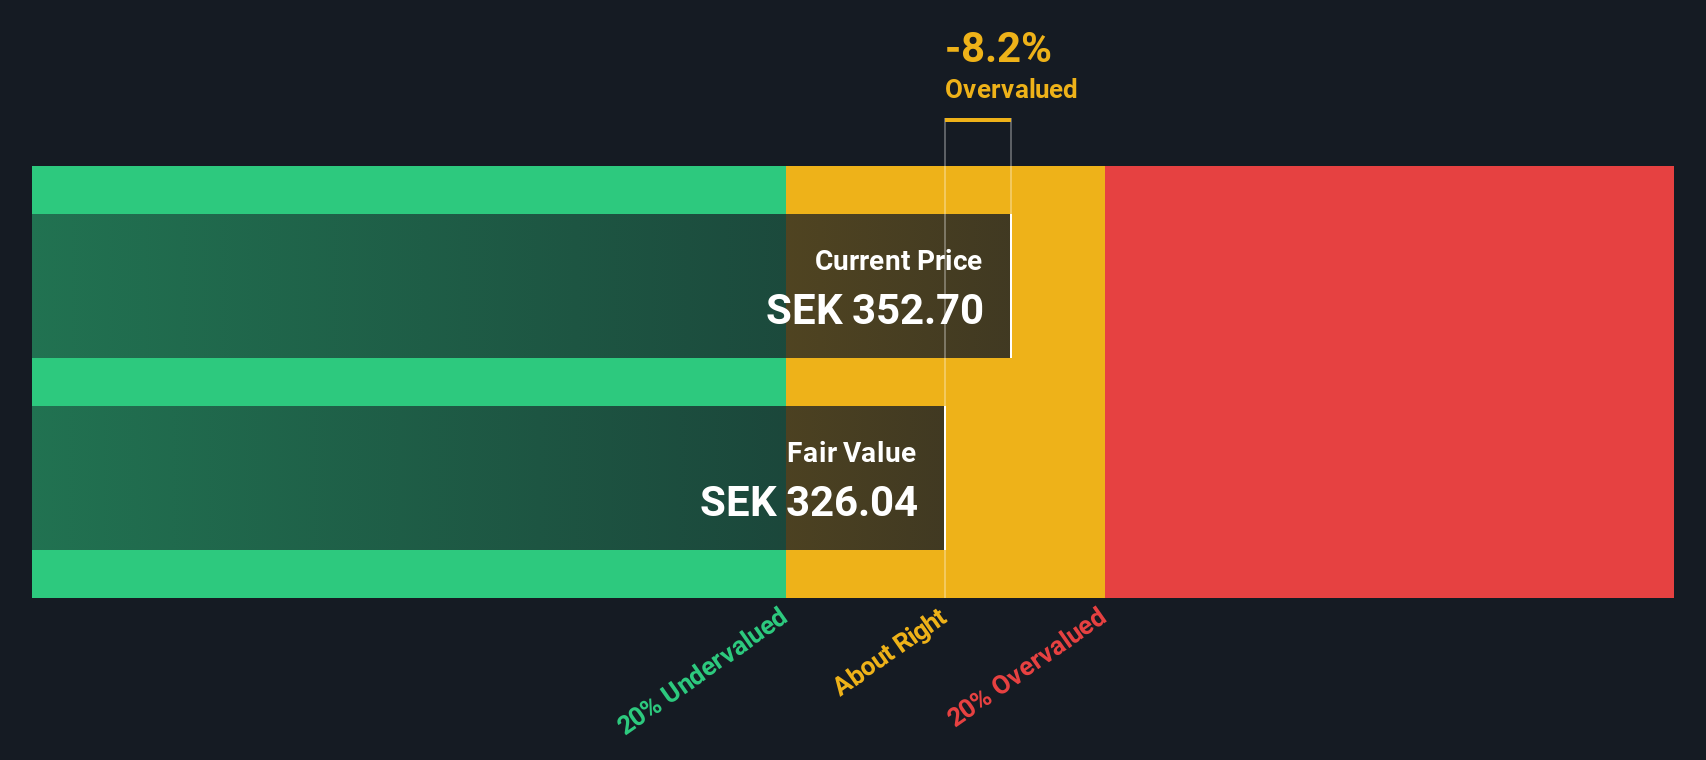
On this basis, EQT’s intrinsic value is estimated at about SEK336 per share, and this implies the stock is roughly 6.4% above its fair value, so only modestly overvalued at today’s price.
Result: ABOUT RIGHT
EQT is fairly valued according to our Excess Returns, but this can change at a moment's notice. Track the value in your watchlist or portfolio and be alerted on when to act.
Approach 2: EQT Price vs Earnings
For a profitable company like EQT, the price to earnings ratio is a useful way to gauge whether investors are paying a reasonable price for each unit of current profit. It naturally captures how the market is weighing today’s earnings against expectations for future growth and the perceived risk of those earnings.
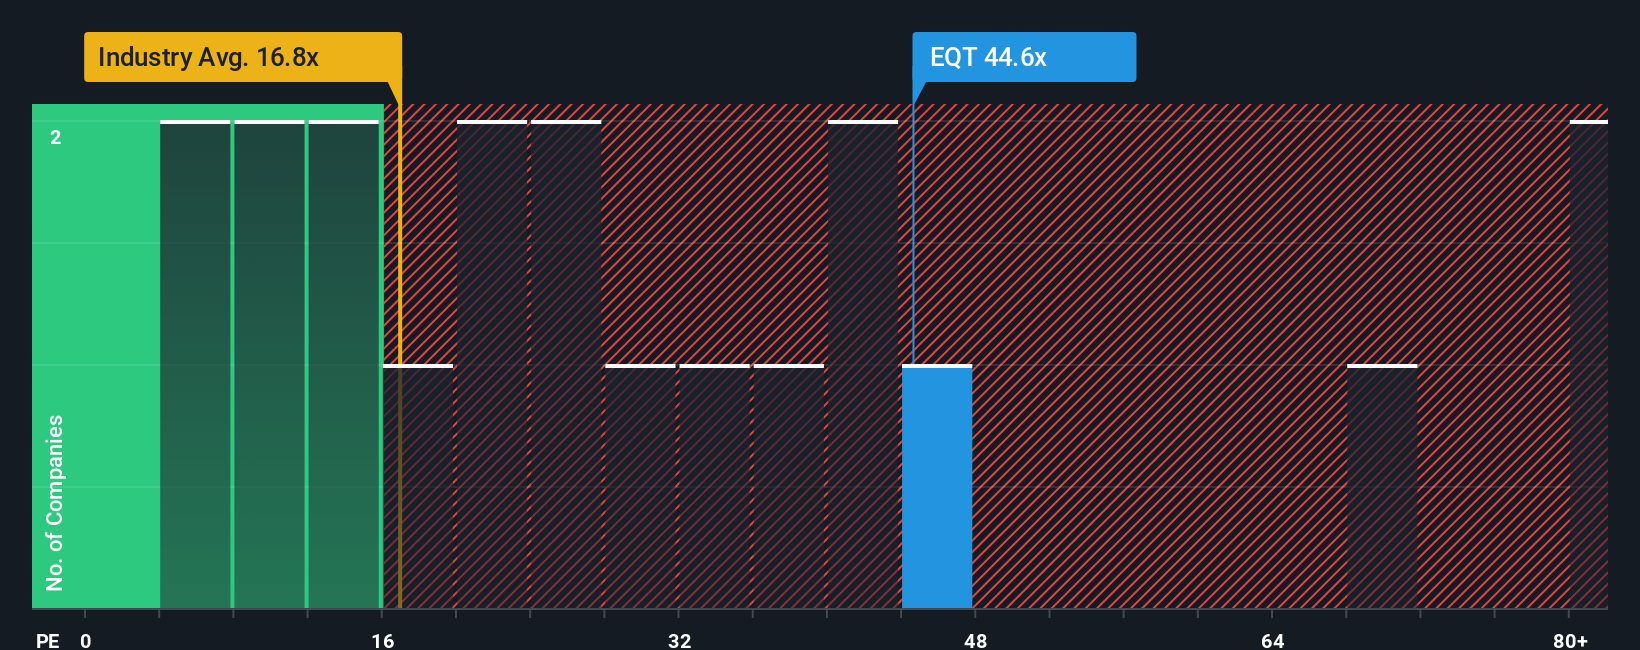
In general, faster growth and lower risk justify a higher PE multiple, while slower or more volatile earnings should trade on a lower multiple. EQT currently trades on a PE of 45.95x, which is well above both the broader Capital Markets industry average of 21.78x and its peer group average of 16.56x. That premium indicates that investors are already pricing in strong growth and a relatively resilient earnings profile.
Simply Wall St’s Fair Ratio metric goes a step further by estimating what PE multiple EQT should trade on given its specific earnings growth outlook, profitability, risk profile, industry positioning and market cap. For EQT, this Fair Ratio is 28.17x, materially below the current 45.95x. This suggests that, even after allowing for its strengths and growth prospects, the stock is pricing in more optimism than the fundamentals justify.
Result: OVERVALUED
PE ratios tell one story, but what if the real opportunity lies elsewhere? Discover 1458 companies where insiders are betting big on explosive growth.
Upgrade Your Decision Making: Choose your EQT Narrative
Earlier we mentioned that there is an even better way to understand valuation, so let us introduce you to Narratives, a simple framework that lets you tell the story behind your numbers by linking your view of a company’s future revenue, earnings and margins directly to a forecast and then to a fair value estimate.
On Simply Wall St’s Community page, used by millions of investors, a Narrative is your personal investment storyline for a company. In a Narrative, you spell out how you think the business will grow, what margins it can achieve, and what multiple it deserves. The platform then instantly turns that story into a dynamic valuation you can compare with today’s share price to inform your decision on whether to buy, hold or sell.
Because Narratives are continuously updated as new information like news or earnings arrives, you can see in real time how different perspectives play out. For example, one EQT investor might build a bullish Narrative that supports a fair value closer to SEK405.55, while a more cautious investor might justify something nearer SEK316.53. By seeing these side by side, you can quickly judge where your own view sits and how much potential upside or downside you believe is still on the table.
Do you think there's more to the story for EQT? Head over to our Community to see what others are saying!
This article by Simply Wall St is general in nature. We provide commentary based on historical data and analyst forecasts only using an unbiased methodology and our articles are not intended to be financial advice. It does not constitute a recommendation to buy or sell any stock, and does not take account of your objectives, or your financial situation. We aim to bring you long-term focused analysis driven by fundamental data. Note that our analysis may not factor in the latest price-sensitive company announcements or qualitative material. Simply Wall St has no position in any stocks mentioned.
Have feedback on this article? Concerned about the content? Get in touch with us directly. Alternatively, email editorial-team@simplywallst.com