
Is There Still Value in Amgen After Its Strong 2025 Share Price Run?
- Wondering if Amgen’s share price already reflects the upside, or if there is still value on the table? You are not alone, and this article is going to tackle that head on from an investor’s perspective.
- Amgen’s stock has quietly put in a solid run, with the price up 1.9% over the last week and 27.8% year to date, even after a small 1.8% pullback over the last month that reminds us risk perceptions can change quickly.
- Recent attention has centered on Amgen’s expanding pipeline in areas like obesity and oncology, as well as regulatory milestones that have reinforced its positioning as a large cap biotech with multiple shots on goal. At the same time, ongoing debates about drug pricing reform and competition in key franchises have kept investors weighing growth opportunities against potential policy and market headwinds.
- Right now Amgen scores a 4 out of 6 on our valuation checks. This suggests it looks undervalued on several fronts but not across the board. Next we will unpack the main valuation methods investors use while hinting at an even more powerful way to think about fair value by the end of this article.
Find out why Amgen's 29.6% return over the last year is lagging behind its peers.
Approach 1: Amgen Discounted Cash Flow (DCF) Analysis
A Discounted Cash Flow model estimates what a company is worth today by projecting the cash it can generate in the future and discounting those cash flows back to their value in the present.
For Amgen, the model starts with last twelve month free cash flow of about $11.7 billion and uses analyst forecasts for the next few years, then extends those trends further out. By 2029, free cash flow is projected to reach roughly $14.6 billion, with additional incremental growth assumed through 2035 based on modest percentage increases each year, as extrapolated by Simply Wall St.
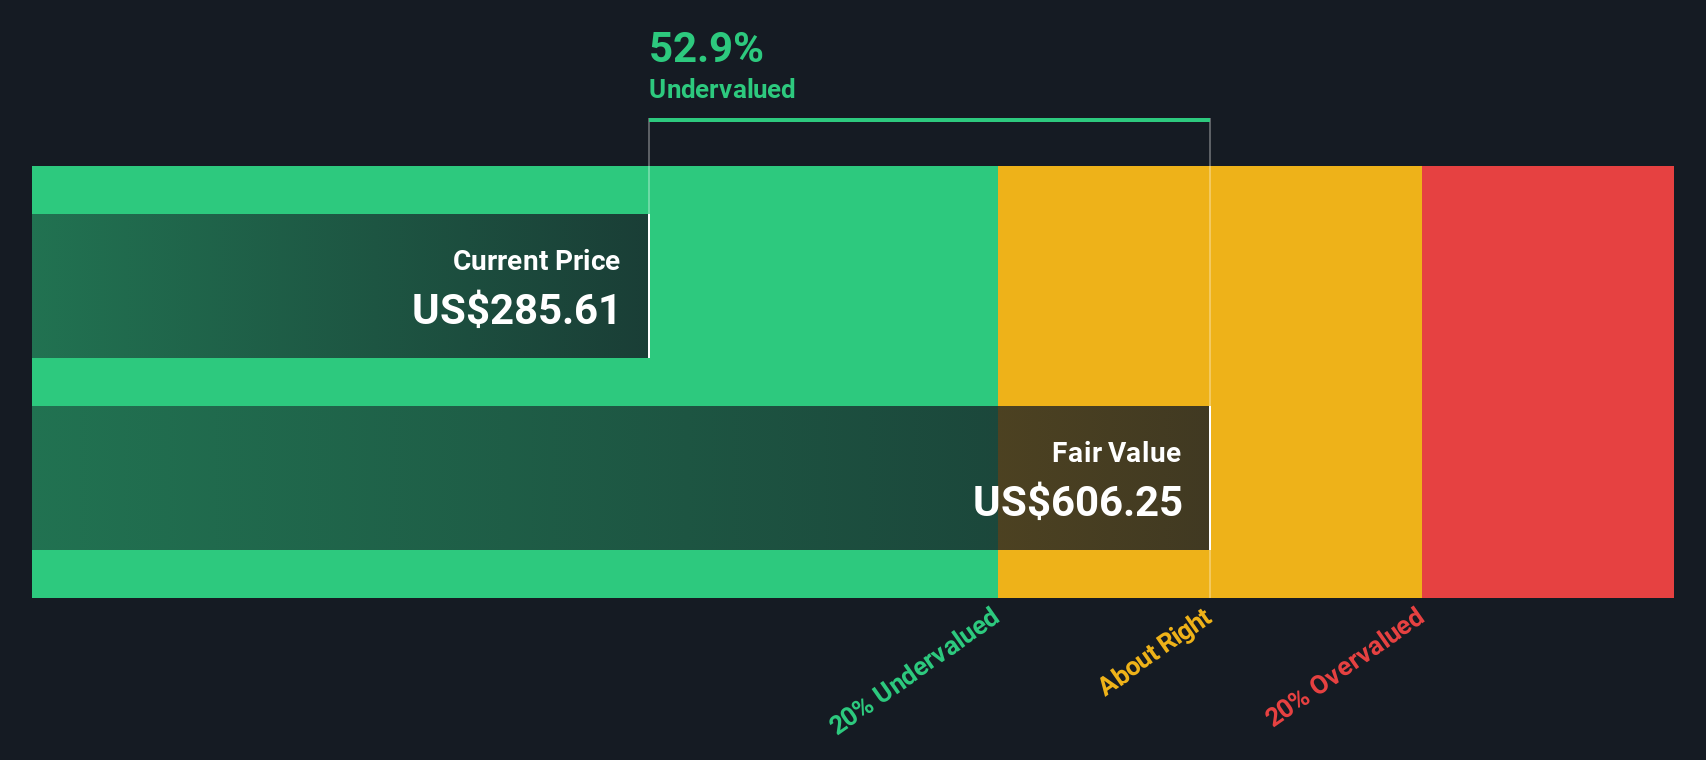
Bringing all those projected cash flows back to today, the 2 Stage Free Cash Flow to Equity model produces an estimated intrinsic value of about $555 per share. Compared with the current market price, this implies Amgen is trading at roughly a 40.3% discount to its DCF based fair value.
Result: UNDERVALUED
Our Discounted Cash Flow (DCF) analysis suggests Amgen is undervalued by 40.3%. Track this in your watchlist or portfolio, or discover 898 more undervalued stocks based on cash flows.
Approach 2: Amgen Price vs Earnings
For a profitable and established company like Amgen, the price to earnings ratio is a useful yardstick because it directly links what investors pay today to the profits the business is generating right now. In broad terms, companies with stronger and more reliable growth, and lower perceived risk, tend to justify higher PE ratios, while slower growth or higher uncertainty usually demands a lower multiple.
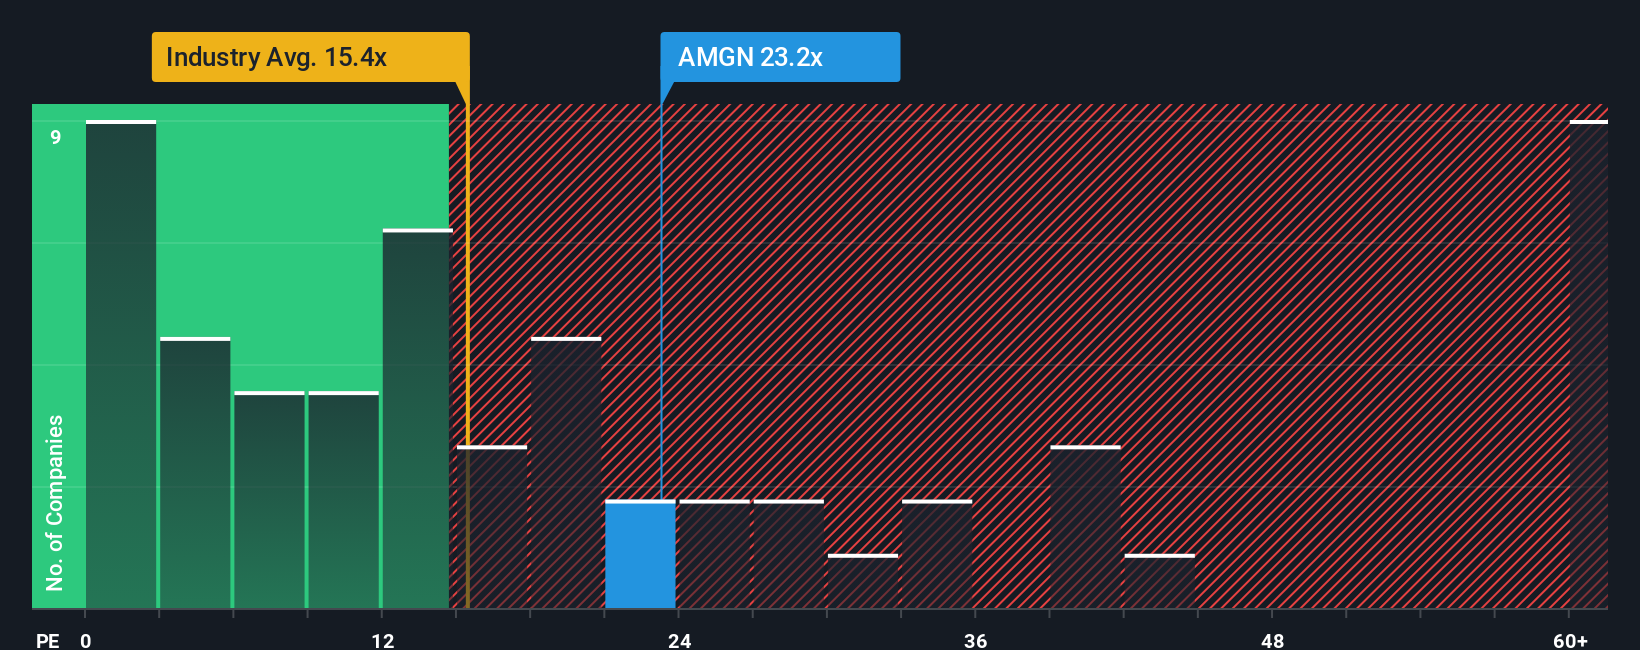
Amgen currently trades on a PE of about 25.5x, which is above the broader Biotechs industry average of roughly 20.4x, and below the approximate 59.9x average for closer large cap peers. Simply Wall St’s proprietary Fair Ratio for Amgen is 29.4x, which is an estimate of what its PE could be given its earnings outlook, profitability, industry, market cap and risk profile.
This Fair Ratio may be more informative than a simple comparison with peers or the sector because it adjusts for Amgen specific fundamentals rather than assuming one size fits all. With Amgen’s actual PE of 25.5x sitting below the Fair Ratio of 29.4x, the shares may appear modestly undervalued on an earnings multiple basis.
Result: UNDERVALUED
PE ratios tell one story, but what if the real opportunity lies elsewhere? Discover 1458 companies where insiders are betting big on explosive growth.
Upgrade Your Decision Making: Choose your Amgen Narrative
Earlier we mentioned that there is an even better way to understand valuation, so let us introduce you to Narratives, an approach that lets you attach a clear story to the numbers by linking your view of Amgen’s future revenues, earnings and margins to a financial forecast and, ultimately, to a Fair Value that you can compare with today’s share price.
On Simply Wall St’s Community page, Narratives are an easy, guided tool used by millions of investors to spell out why they think a company will flourish or struggle, translate that story into explicit assumptions, and then see the implied Fair Value update dynamically as new news or earnings data comes in.
For Amgen, for example, one Narrative might assume resilient pricing, AI enabled R and D gains and strong obesity and oncology launches that justify a Fair Value near $425. A more cautious Narrative could instead lean on slower growth, margin pressure and tougher competition that supports a Fair Value closer to $219. By setting up or exploring these different perspectives, you can decide whether the current price looks attractive enough to buy, stretched enough to sell, or reasonable to simply hold.
For Amgen however we'll make it really easy for you with previews of two leading Amgen Narratives:
Fair Value: $425.00
Implied discount vs current price: 22.1% undervalued
Revenue growth assumption: 5.58%
- Assumes Amgen can outgrow expectations via broad volume driven growth across obesity, oncology, inflammation and rare disease products, supported by AI enabled R and D and frequent high impact launches.
- Sees resilient pricing, expanding biosimilars and a stronger global footprint combining to lift margins toward the low 30s and drive powerful free cash flow generation.
- Believes disciplined capital allocation and M and A capacity can compound earnings further, justifying a Fair Value well above today’s price despite policy and patent risks.
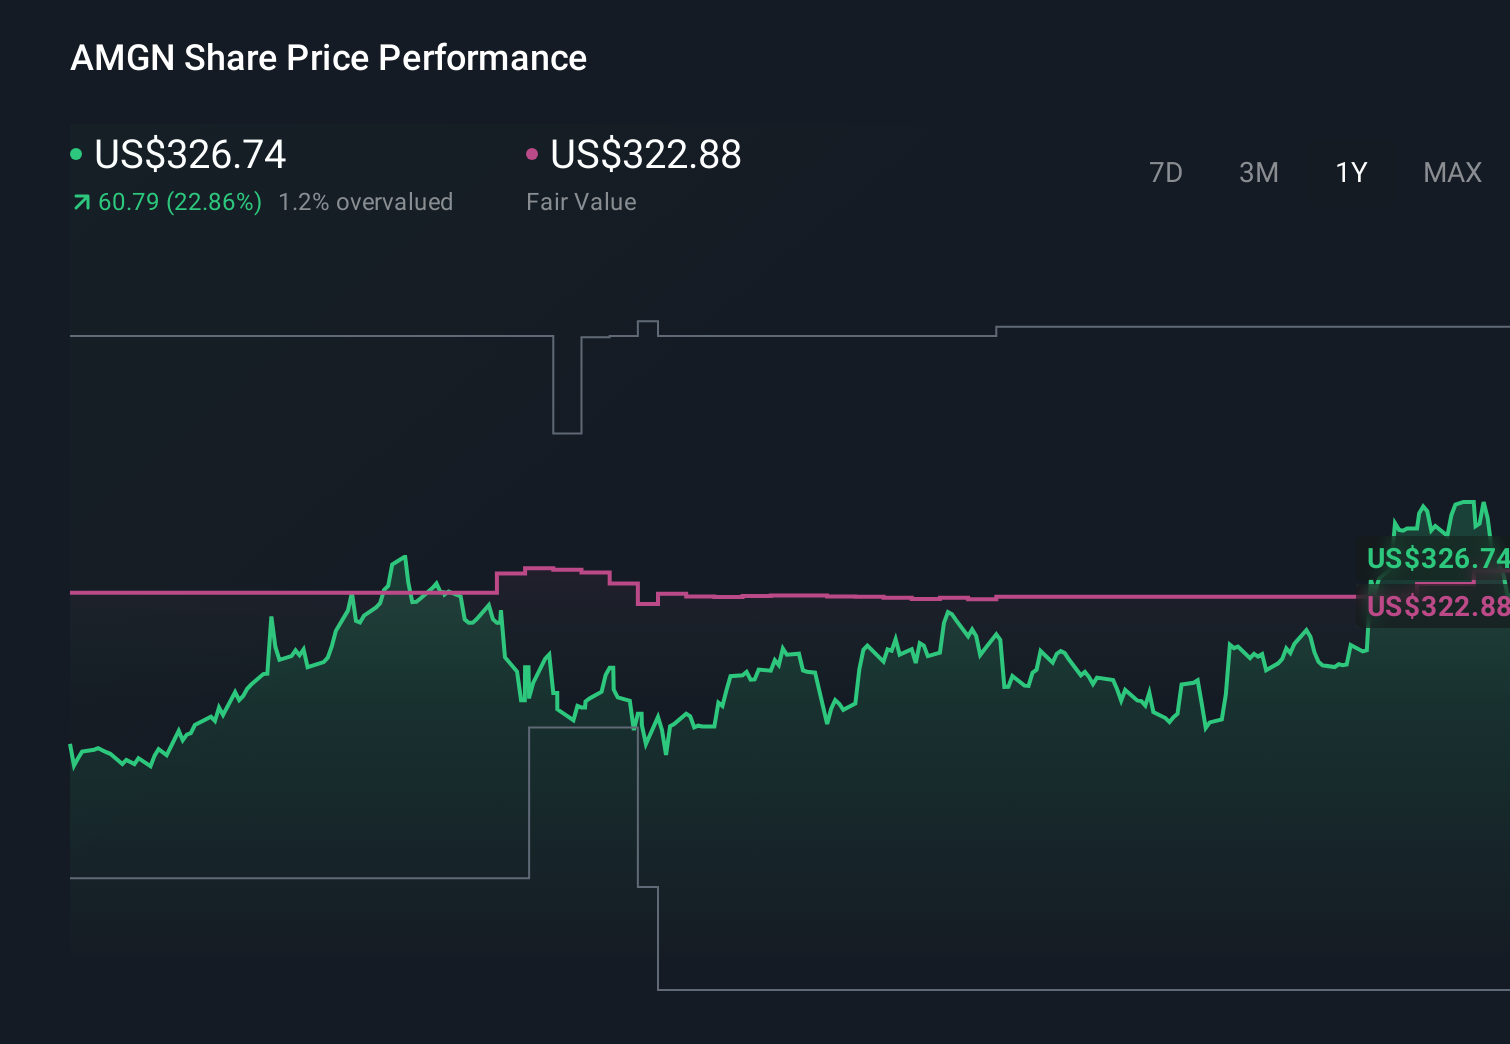
Fair Value: $322.88
Implied premium vs current price: 2.6% overvalued
Revenue growth assumption: 2.05%
- Frames Amgen as a steady, defensive large cap where revenue growth remains modest as patent expiries, biosimilar competition and pricing pressure offset pipeline contributions.
- Assumes only gradual margin expansion, with heavy R and D and manufacturing investment, regulatory uncertainty and competitive obesity offerings limiting upside.
- Suggests the stock already prices in much of the expected progress, with Fair Value only slightly above consensus and close to the current share price.
Do you think there's more to the story for Amgen? Head over to our Community to see what others are saying!
This article by Simply Wall St is general in nature. We provide commentary based on historical data and analyst forecasts only using an unbiased methodology and our articles are not intended to be financial advice. It does not constitute a recommendation to buy or sell any stock, and does not take account of your objectives, or your financial situation. We aim to bring you long-term focused analysis driven by fundamental data. Note that our analysis may not factor in the latest price-sensitive company announcements or qualitative material. Simply Wall St has no position in any stocks mentioned.
Have feedback on this article? Concerned about the content? Get in touch with us directly. Alternatively, email editorial-team@simplywallst.com