
- PREMIUM
- LIVE QUOTES
- INSTITUTIONS
 Index Options
 State Street
 CME Group
 Nasdaq
 Cboe
Cboe TradingView
 Wall Street Journal
Has the Rio Tinto Share Price Rally in 2025 Gone Too Far?
- Wondering if Rio Tinto Group is still good value after a strong run, or if you might be late to the party? This breakdown is designed to give you a clear, no nonsense view of what you are really paying for.
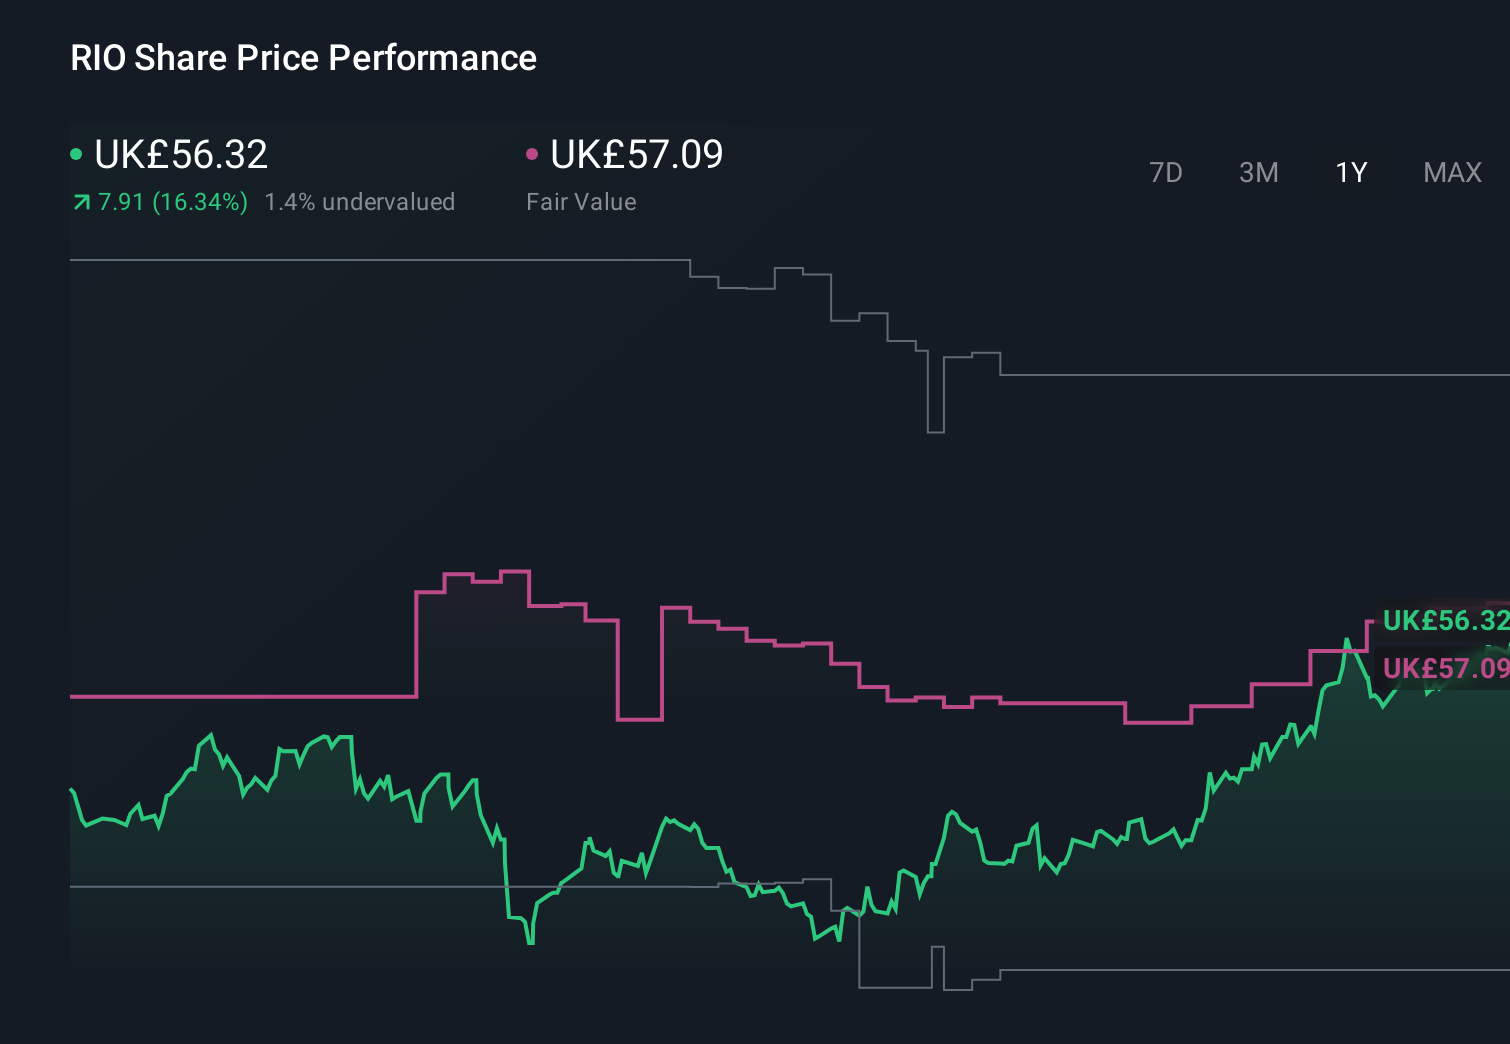
- The stock has climbed 5.3% over the last week, 11.7% over the last month, and is now up 24.5% year to date and 34.2% over the past year. These moves naturally raise the question of whether the shares are starting to look fully priced or still offer upside.
- Recent headlines have focused on Rio Tinto's strategic push to secure long life iron ore assets and expand in copper to tap into long term electrification demand, as well as its ongoing efforts to simplify the portfolio and improve capital discipline. At the same time, debates around Chinese steel demand, commodity price volatility, and Rio Tinto's environmental and community footprint have all fed into shifting market sentiment and helped shape these price moves.
- On our checklist driven valuation lens, Rio Tinto scores a 5 out of 6 on undervaluation checks, giving it a valuation score of 5/6. This indicates the market may still be underestimating its fundamentals. Next, we will walk through the main valuation approaches behind that score, and then finish with a more holistic way of thinking about what Rio Tinto is really worth in the long run.
Find out why Rio Tinto Group's 34.2% return over the last year is lagging behind its peers.
Approach 1: Rio Tinto Group Discounted Cash Flow (DCF) Analysis
A Discounted Cash Flow model estimates what a business is worth by projecting the cash it can generate in the future and then discounting those cash flows back to today to reflect risk and the time value of money.
For Rio Tinto Group, the model starts from last twelve month free cash flow of about $7.1 Billion and uses analyst forecasts for the next few years, then extends those estimates further out. Simply Wall St applies a 2 Stage Free Cash Flow to Equity approach, with detailed projections out to 2035, where free cash flow is expected to rise toward roughly the mid teens in Billions of dollars.
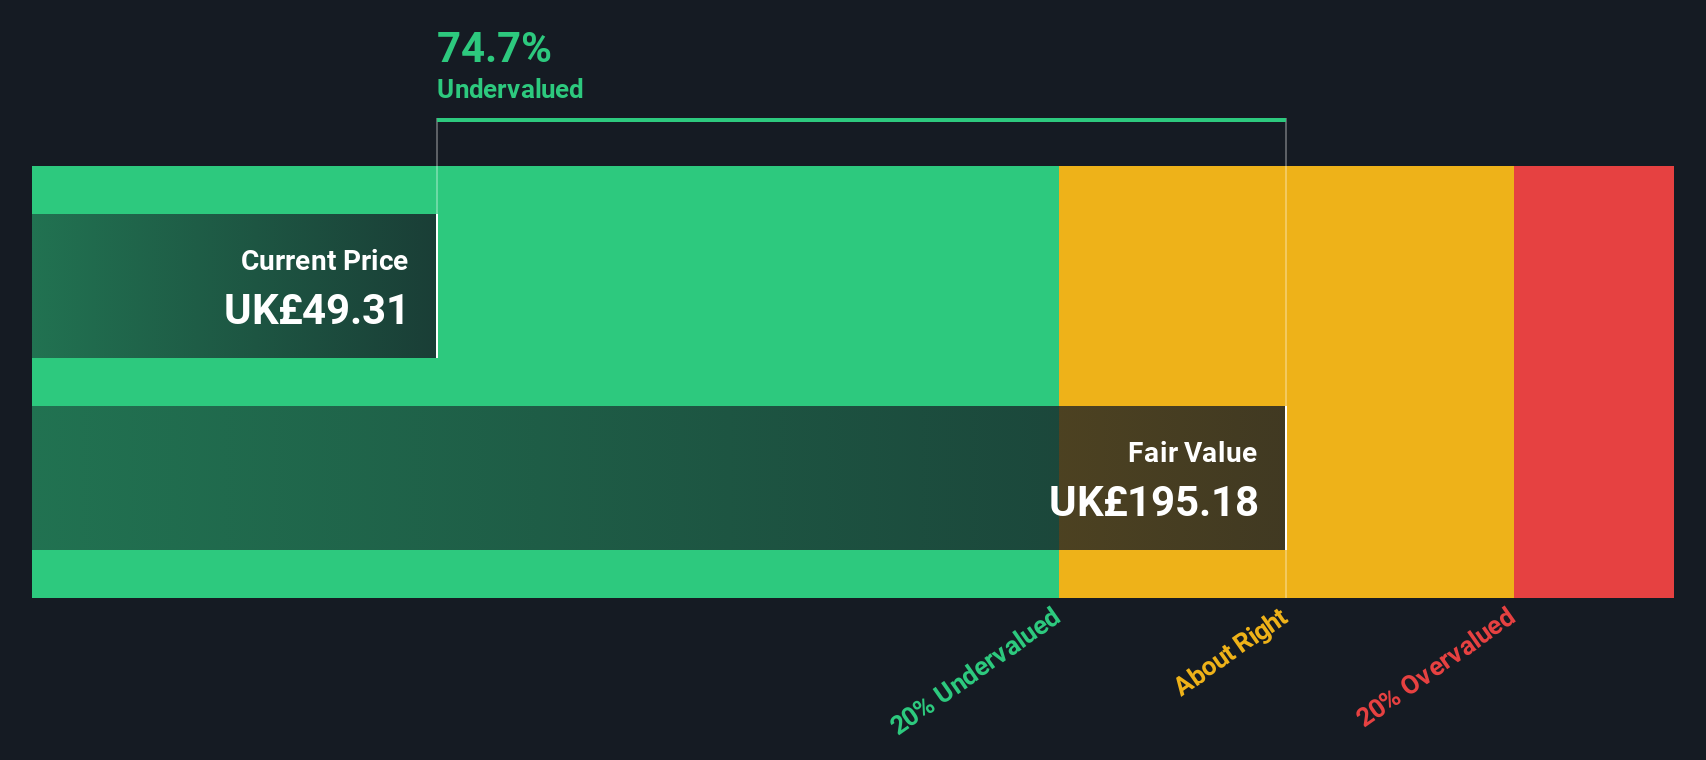
When all these future cash flows are discounted back to today, the DCF model arrives at an estimated intrinsic value of about $89.25 per share. Versus the current market price, this implies the shares trade at roughly a 33.5% discount, suggesting investors are not fully pricing in Rio Tinto's future cash generation.
Result: UNDERVALUED
Our Discounted Cash Flow (DCF) analysis suggests Rio Tinto Group is undervalued by 33.5%. Track this in your watchlist or portfolio, or discover 898 more undervalued stocks based on cash flows.
Approach 2: Rio Tinto Group Price vs Earnings
For a profitable, established business like Rio Tinto, the price to earnings, or PE, ratio is a useful way to gauge how much investors are paying for each unit of current earnings. It captures, in a single number, the market's view on both the durability of profits and the growth still ahead.
What counts as a normal or fair PE depends on how fast earnings are expected to grow and how risky those earnings are. Higher growth and lower perceived risk usually justify a higher multiple, while cyclical or uncertain earnings tend to trade on lower PEs.
Rio Tinto currently trades on about 12.6x earnings, which is below both the metals and mining industry average of roughly 18.1x and well under the peer group average of about 47.6x. Simply Wall St also calculates a Fair Ratio of 25.7x, a proprietary estimate of the PE Rio Tinto should trade on given its earnings growth outlook, industry, margins, size, and risk profile. This Fair Ratio is more tailored than a simple peer comparison because it adjusts for those company specific factors rather than assuming all miners deserve the same multiple. With the shares at 12.6x versus a Fair Ratio of 25.7x, the valuation still looks meaningfully undemanding.
Result: UNDERVALUED
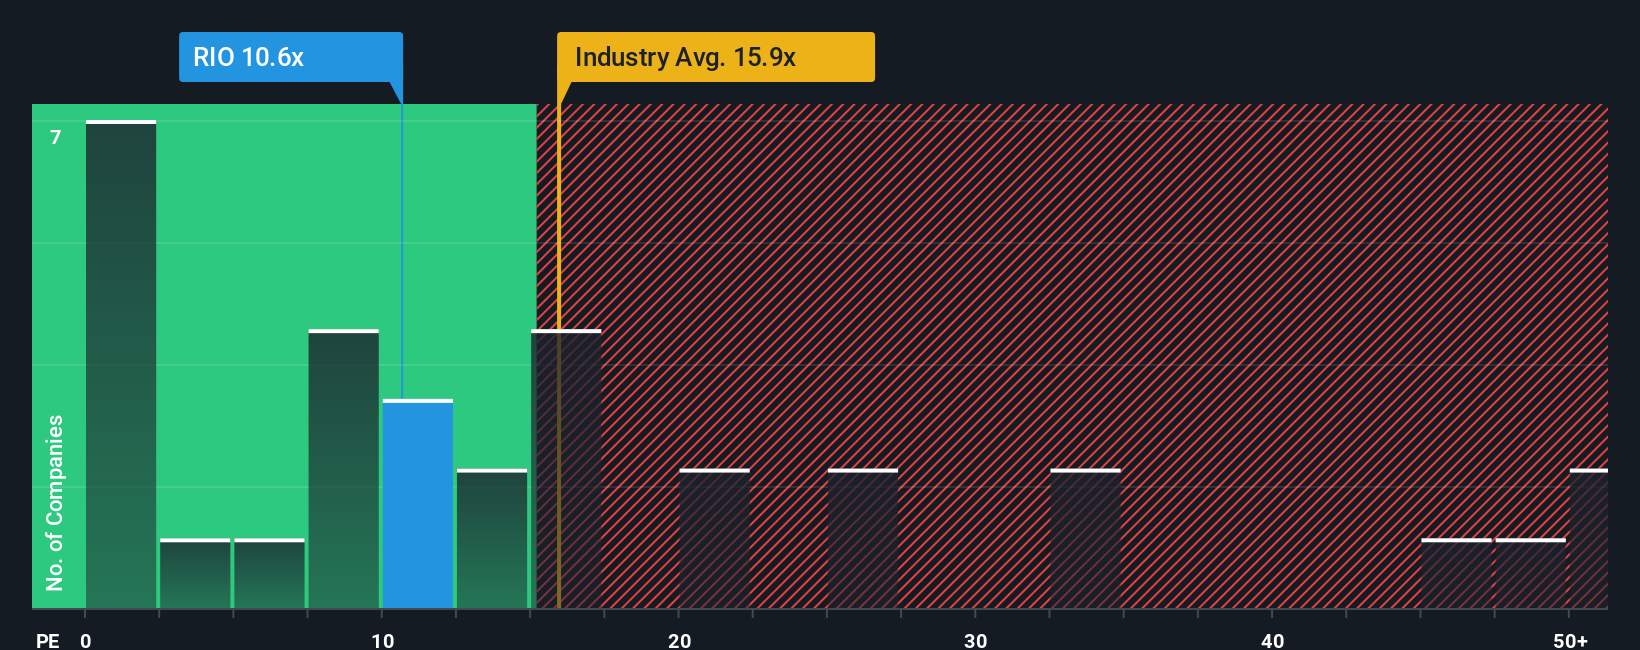
PE ratios tell one story, but what if the real opportunity lies elsewhere? Discover 1458 companies where insiders are betting big on explosive growth.
Upgrade Your Decision Making: Choose your Rio Tinto Group Narrative
Earlier we mentioned that there is an even better way to understand valuation. Let's introduce you to Narratives, an easy tool on Simply Wall St's Community page that lets you turn your view of Rio Tinto Group into a clear story backed by numbers. It links what you believe about its projects, markets, and risks to specific revenue, earnings, and margin forecasts, which then roll up into a Fair Value you can compare to the current share price to help you decide whether to buy, hold, or sell. These Narratives automatically refresh as new news or earnings arrive. Two investors can reasonably disagree: one might build a bullish Narrative around accelerating copper and lithium growth and assign a higher fair value closer to the top analyst target of about £66.68. Another might focus on execution and commodity risk, assume lower growth and margins, and land nearer the most cautious target of roughly £41.00. Both can see exactly how their assumptions drive their valuation and where they differ from the market.
Do you think there's more to the story for Rio Tinto Group? Head over to our Community to see what others are saying!
This article by Simply Wall St is general in nature. We provide commentary based on historical data and analyst forecasts only using an unbiased methodology and our articles are not intended to be financial advice. It does not constitute a recommendation to buy or sell any stock, and does not take account of your objectives, or your financial situation. We aim to bring you long-term focused analysis driven by fundamental data. Note that our analysis may not factor in the latest price-sensitive company announcements or qualitative material. Simply Wall St has no position in any stocks mentioned.
Have feedback on this article? Concerned about the content? Get in touch with us directly. Alternatively, email editorial-team@simplywallst.com