
- PREMIUM
- LIVE QUOTES
- INSTITUTIONS
 Index Options
 State Street
 CME Group
 Nasdaq
 Cboe
Cboe TradingView
 Wall Street Journal
Private companies are Neurones S.A.'s (EPA:NRO) biggest owners and were hit after market cap dropped €47m
Key Insights
- Significant control over Neurones by private companies implies that the general public has more power to influence management and governance-related decisions
- The top 2 shareholders own 51% of the company
- 11% of Neurones is held by Institutions
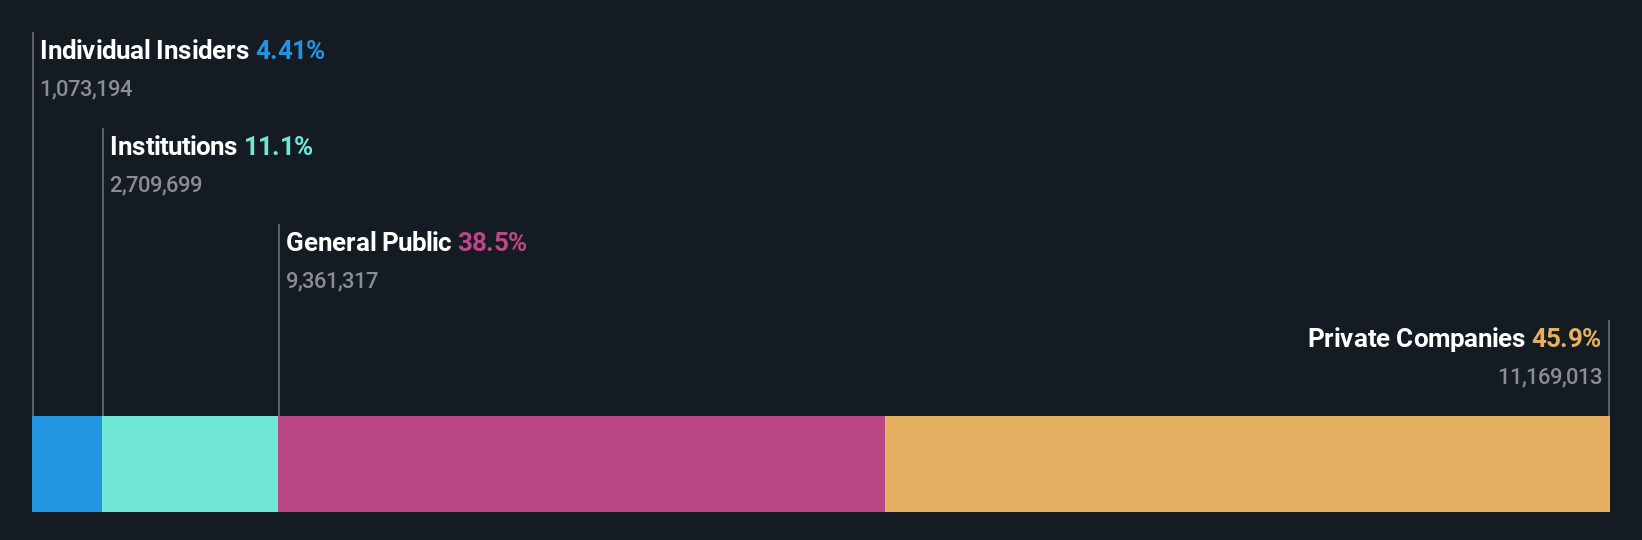
To get a sense of who is truly in control of Neurones S.A. (EPA:NRO), it is important to understand the ownership structure of the business. And the group that holds the biggest piece of the pie are private companies with 46% ownership. That is, the group stands to benefit the most if the stock rises (or lose the most if there is a downturn).
As market cap fell to €1.0b last week, private companies would have faced the highest losses than any other shareholder groups of the company.
Let's delve deeper into each type of owner of Neurones, beginning with the chart below.
Check out our latest analysis for Neurones
What Does The Institutional Ownership Tell Us About Neurones?
Many institutions measure their performance against an index that approximates the local market. So they usually pay more attention to companies that are included in major indices.
Neurones already has institutions on the share registry. Indeed, they own a respectable stake in the company. This implies the analysts working for those institutions have looked at the stock and they like it. But just like anyone else, they could be wrong. When multiple institutions own a stock, there's always a risk that they are in a 'crowded trade'. When such a trade goes wrong, multiple parties may compete to sell stock fast. This risk is higher in a company without a history of growth. You can see Neurones' historic earnings and revenue below, but keep in mind there's always more to the story.

Hedge funds don't have many shares in Neurones. Host Developpement is currently the company's largest shareholder with 46% of shares outstanding. With 5.0% and 2.3% of the shares outstanding respectively, Invesco Ltd. and Bertrand Ducurtil are the second and third largest shareholders. Bertrand Ducurtil, who is the third-largest shareholder, also happens to hold the title of Member of the Board of Directors. Furthermore, CEO Luc de Chammard is the owner of 2.1% of the company's shares.
A more detailed study of the shareholder registry showed us that 2 of the top shareholders have a considerable amount of ownership in the company, via their 51% stake.
While studying institutional ownership for a company can add value to your research, it is also a good practice to research analyst recommendations to get a deeper understand of a stock's expected performance. While there is some analyst coverage, the company is probably not widely covered. So it could gain more attention, down the track.
Insider Ownership Of Neurones
The definition of an insider can differ slightly between different countries, but members of the board of directors always count. Management ultimately answers to the board. However, it is not uncommon for managers to be executive board members, especially if they are a founder or the CEO.
Most consider insider ownership a positive because it can indicate the board is well aligned with other shareholders. However, on some occasions too much power is concentrated within this group.
Shareholders would probably be interested to learn that insiders own shares in Neurones S.A.. It is a pretty big company, so it is generally a positive to see some potentially meaningful alignment. In this case, they own around €45m worth of shares (at current prices). Most would say this shows alignment of interests between shareholders and the board. Still, it might be worth checking if those insiders have been selling.
General Public Ownership
The general public-- including retail investors -- own 39% stake in the company, and hence can't easily be ignored. While this group can't necessarily call the shots, it can certainly have a real influence on how the company is run.
Private Company Ownership
Our data indicates that Private Companies hold 46%, of the company's shares. It's hard to draw any conclusions from this fact alone, so its worth looking into who owns those private companies. Sometimes insiders or other related parties have an interest in shares in a public company through a separate private company.
Next Steps:
While it is well worth considering the different groups that own a company, there are other factors that are even more important.
I like to dive deeper into how a company has performed in the past. You can access this interactive graph of past earnings, revenue and cash flow, for free.
But ultimately it is the future, not the past, that will determine how well the owners of this business will do. Therefore we think it advisable to take a look at this free report showing whether analysts are predicting a brighter future.
NB: Figures in this article are calculated using data from the last twelve months, which refer to the 12-month period ending on the last date of the month the financial statement is dated. This may not be consistent with full year annual report figures.
Have feedback on this article? Concerned about the content? Get in touch with us directly. Alternatively, email editorial-team (at) simplywallst.com.
This article by Simply Wall St is general in nature. We provide commentary based on historical data and analyst forecasts only using an unbiased methodology and our articles are not intended to be financial advice. It does not constitute a recommendation to buy or sell any stock, and does not take account of your objectives, or your financial situation. We aim to bring you long-term focused analysis driven by fundamental data. Note that our analysis may not factor in the latest price-sensitive company announcements or qualitative material. Simply Wall St has no position in any stocks mentioned.