
- PREMIUM
- LIVE QUOTES
- INSTITUTIONS
 Index Options
 State Street
 CME Group
 Nasdaq
 Cboe
Cboe TradingView
 Wall Street Journal
Does Sony Still Offer Value After Its Big Multi Year Share Price Run?
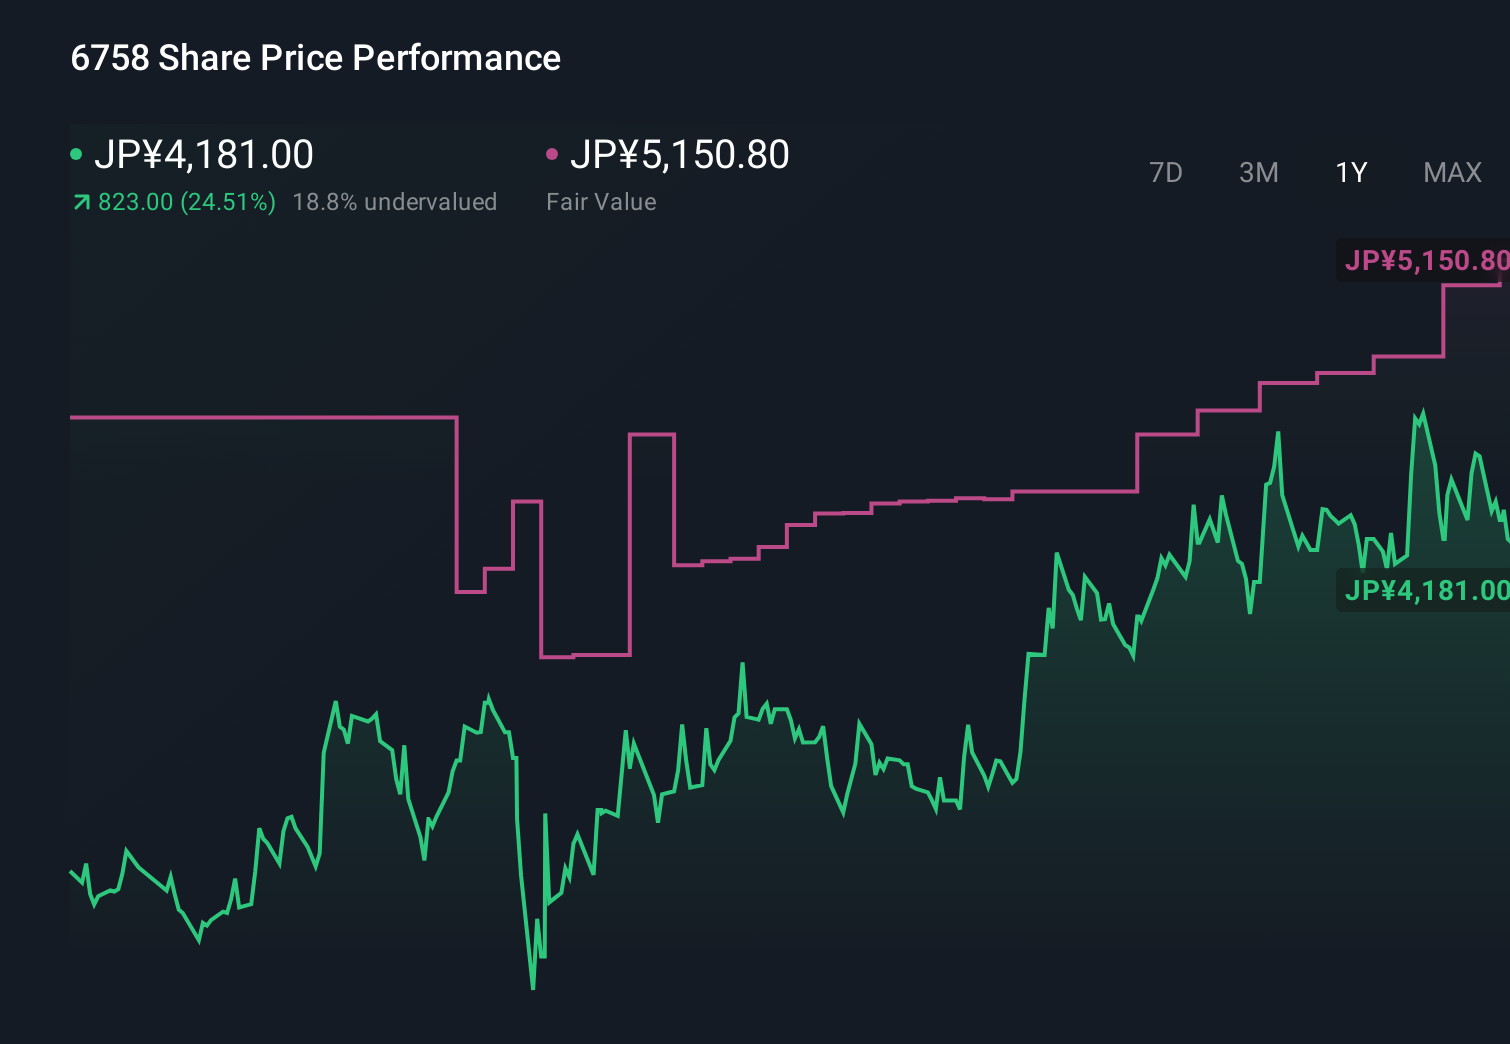
- If you are wondering whether Sony Group is still a smart buy after its big run over the last few years, or if the easy money has already been made, you are not alone.
- The stock is down roughly 4.3% over the last week and 12.1% over the last month, but it is still up about 20% year to date and 26.5% over the past year, with a 106.9% gain over 3 years and 110.3% over 5 years.
- Recent moves have been shaped by ongoing optimism around Sony's PlayStation ecosystem and content library, as well as its sensor and entertainment businesses benefiting from structural demand in gaming and streaming. At the same time, shifting risk appetite in global markets has made investors more sensitive to what they are actually paying for that growth story.
- On our checklist of undervaluation signals, Sony Group scores 3 out of 6. This suggests the market might not be fully pricing in its strengths, but also is not giving it away cheaply. Next, we will walk through the main valuation approaches analysts use for Sony and then finish with a more holistic way to think about its true value.
Approach 1: Sony Group Discounted Cash Flow (DCF) Analysis
A Discounted Cash Flow model estimates what a business is worth today by projecting the cash it can generate in the future and then discounting those cash flows back into today’s yen.
For Sony Group, the latest twelve month Free Cash Flow sits around ¥1.52 trillion, already a substantial cash engine. Analysts provide detailed forecasts for the next few years. Beyond that point, Simply Wall St extrapolates a slower, more mature trajectory. On this basis, Sony’s Free Cash Flow is expected to be roughly ¥1.21 trillion by 2030, suggesting a relatively stable long term cash profile rather than explosive growth.
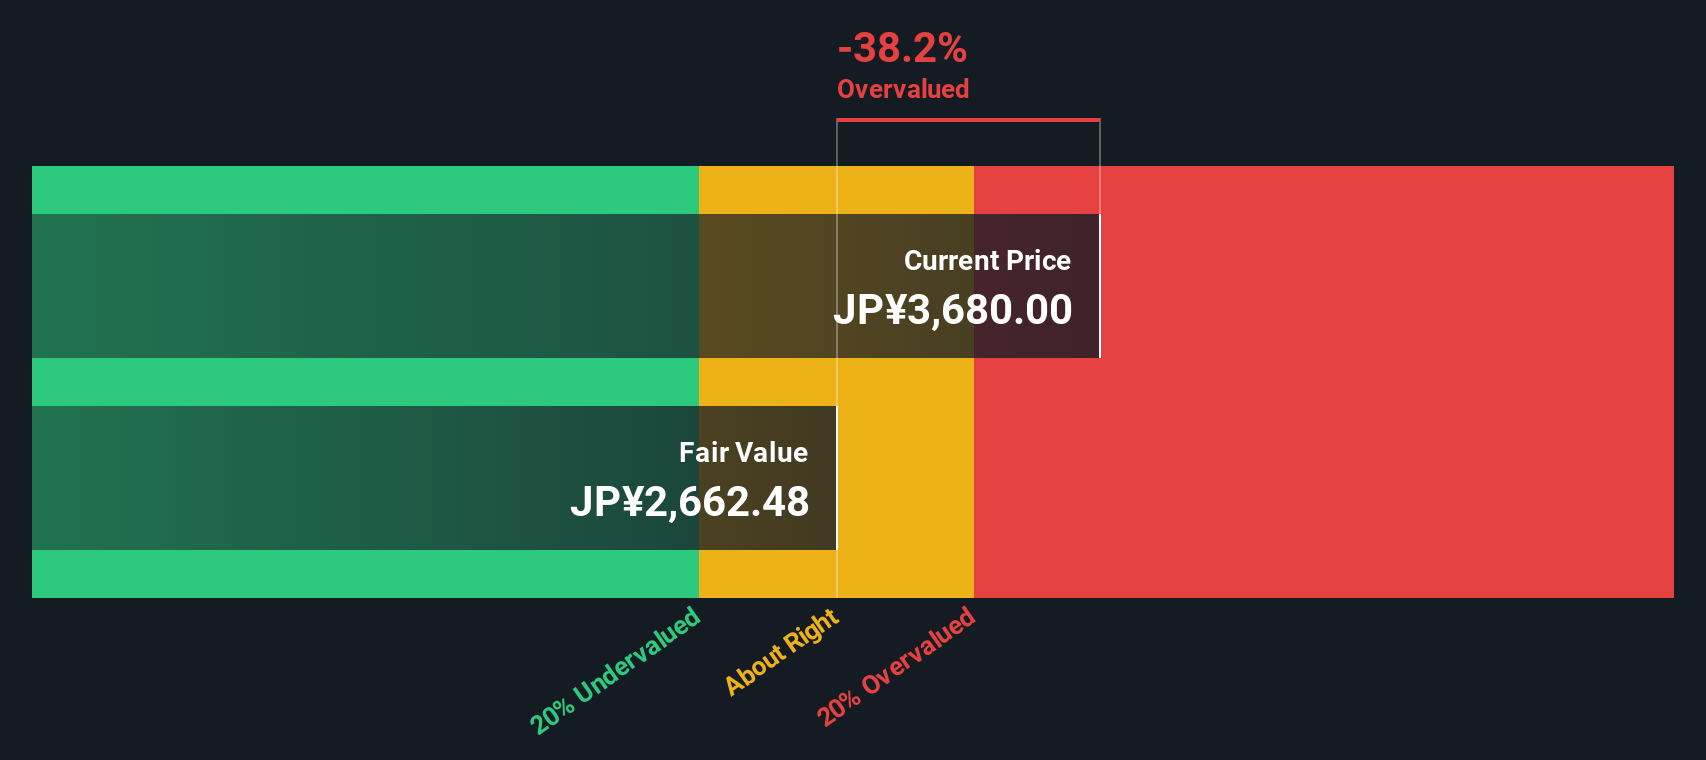
When all of these projected cash flows are discounted back under the 2 Stage Free Cash Flow to Equity model, the implied intrinsic value comes out at about ¥3,250 per share. With the DCF indicating the stock is roughly 21.9% above this level, the model points to Sony Group trading at a premium to its underlying cash generation.
Result: OVERVALUED
Our Discounted Cash Flow (DCF) analysis suggests Sony Group may be overvalued by 21.9%. Discover 899 undervalued stocks or create your own screener to find better value opportunities.
Approach 2: Sony Group Price vs Earnings
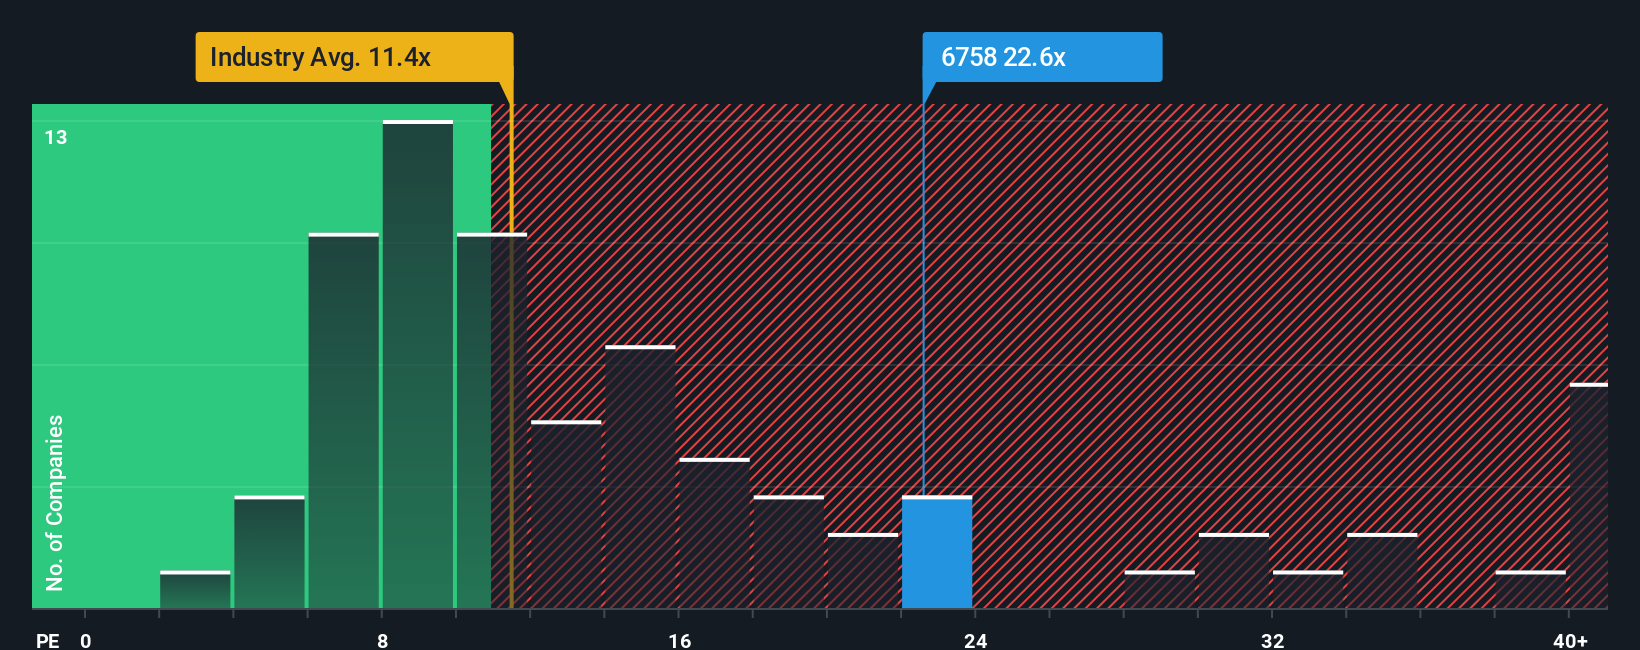
For profitable companies like Sony Group, the Price to Earnings (PE) ratio is a practical way to gauge how much investors are willing to pay for each unit of current earnings. It reflects expectations for future growth and the risk investors see in those earnings, with faster growing, lower risk businesses typically justifying a higher PE.
Sony currently trades on a PE of 19.52x. That is well above the broader Consumer Durables industry average of 11.70x, but meaningfully below the 28.23x average of closer peers, which tend to be larger, brand rich, global franchises. To move beyond these blunt comparisons, Simply Wall St calculates a proprietary “Fair Ratio” of 26.50x, which estimates the PE Sony could trade on after factoring in its earnings growth profile, profit margins, industry dynamics, market cap, and company specific risks.
This Fair Ratio is more tailored than simple peer or sector averages because it weights Sony’s own fundamentals rather than assuming all Consumer Durables or peer stocks deserve the same multiple. With the current PE of 19.52x sitting notably below the 26.50x Fair Ratio, Sony Group appears undervalued on a multiples basis.
Result: UNDERVALUED
PE ratios tell one story, but what if the real opportunity lies elsewhere? Discover 1458 companies where insiders are betting big on explosive growth.
Upgrade Your Decision Making: Choose your Sony Group Narrative
Earlier we mentioned that there is an even better way to understand valuation. Let us introduce you to Narratives, a simple tool on Simply Wall St’s Community page that lets you turn your view of Sony Group’s future revenue, earnings and margins into a story backed by a financial forecast, a fair value, and an indication of whether the stock may be over- or undervalued by comparing that fair value to today’s price. All of this then updates dynamically as new news or earnings arrive. For example, one investor might build a bullish Sony Narrative that leans into gaming and music subscriptions and arrives at a fair value near ¥5,350 per share. Another, more cautious investor might focus on geopolitical and competitive risks and land closer to ¥4,000, with each Narrative transparently showing the assumptions behind its numbers so you can quickly see which story you find more reasonable and factor that into your own decision making.
Do you think there's more to the story for Sony Group? Head over to our Community to see what others are saying!
This article by Simply Wall St is general in nature. We provide commentary based on historical data and analyst forecasts only using an unbiased methodology and our articles are not intended to be financial advice. It does not constitute a recommendation to buy or sell any stock, and does not take account of your objectives, or your financial situation. We aim to bring you long-term focused analysis driven by fundamental data. Note that our analysis may not factor in the latest price-sensitive company announcements or qualitative material. Simply Wall St has no position in any stocks mentioned.
Have feedback on this article? Concerned about the content? Get in touch with us directly. Alternatively, email editorial-team@simplywallst.com