
- PREMIUM
- LIVE QUOTES
- INSTITUTIONS
 Index Options
 State Street
 CME Group
 Nasdaq
 Cboe
Cboe TradingView
 Wall Street Journal
Assessing Amazon Stock After AI Expansion and Regulatory Scrutiny in 2025
- Wondering if Amazon.com is still attractive at today’s price, or if most of the upside has already been realized? This breakdown will help you assess whether the current market valuation makes sense.
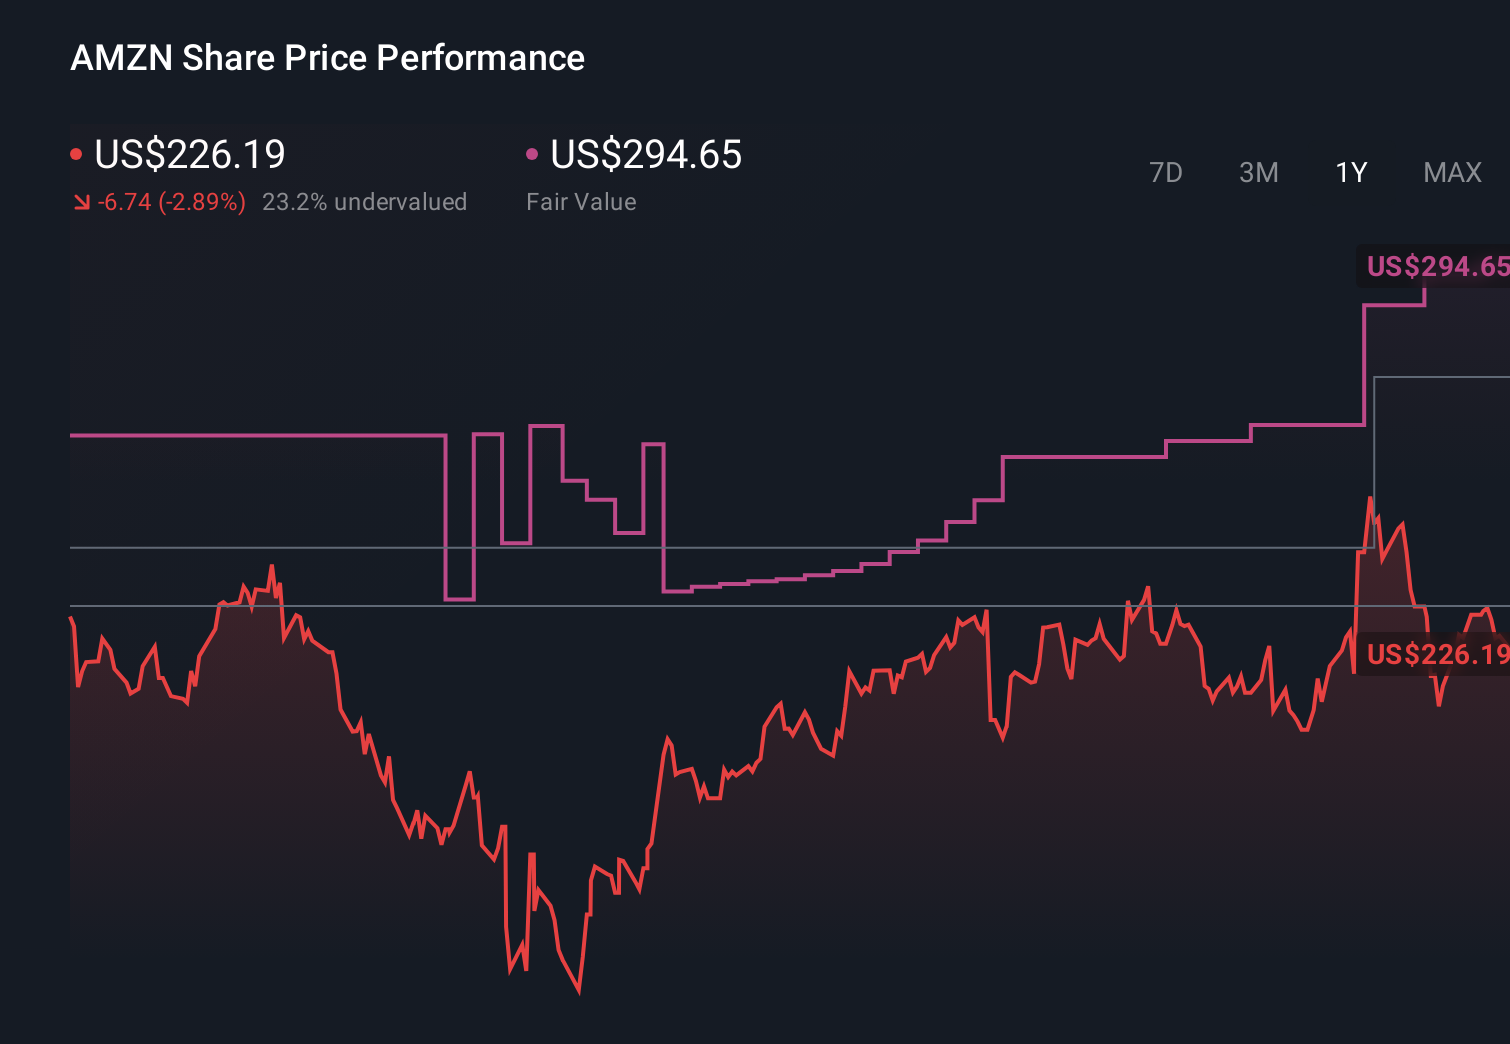
- Over the last week the stock is up 2.6%, with a 3.5% gain over the past month and a 3.7% return year to date. The longer term 3 year return of 167.9% and 5 year return of 39.1% show how quickly sentiment around Amazon.com can shift.
- Recent headlines have focused on Amazon.com increasing its investment in AI infrastructure and cloud services, as well as expanding its logistics network to tighten delivery times. At the same time, regulators and policymakers continue to scrutinize large tech platforms, which adds another layer of risk that investors are quietly pricing into the shares.
- On our 6 point valuation checklist Amazon.com scores 5 out of 6, suggesting the stock still looks undervalued on several key metrics. Next we will walk through the main valuation approaches that drive that score and, more importantly, an additional way to think about what the company may be worth.
Find out why Amazon.com's 1.5% return over the last year is lagging behind its peers.
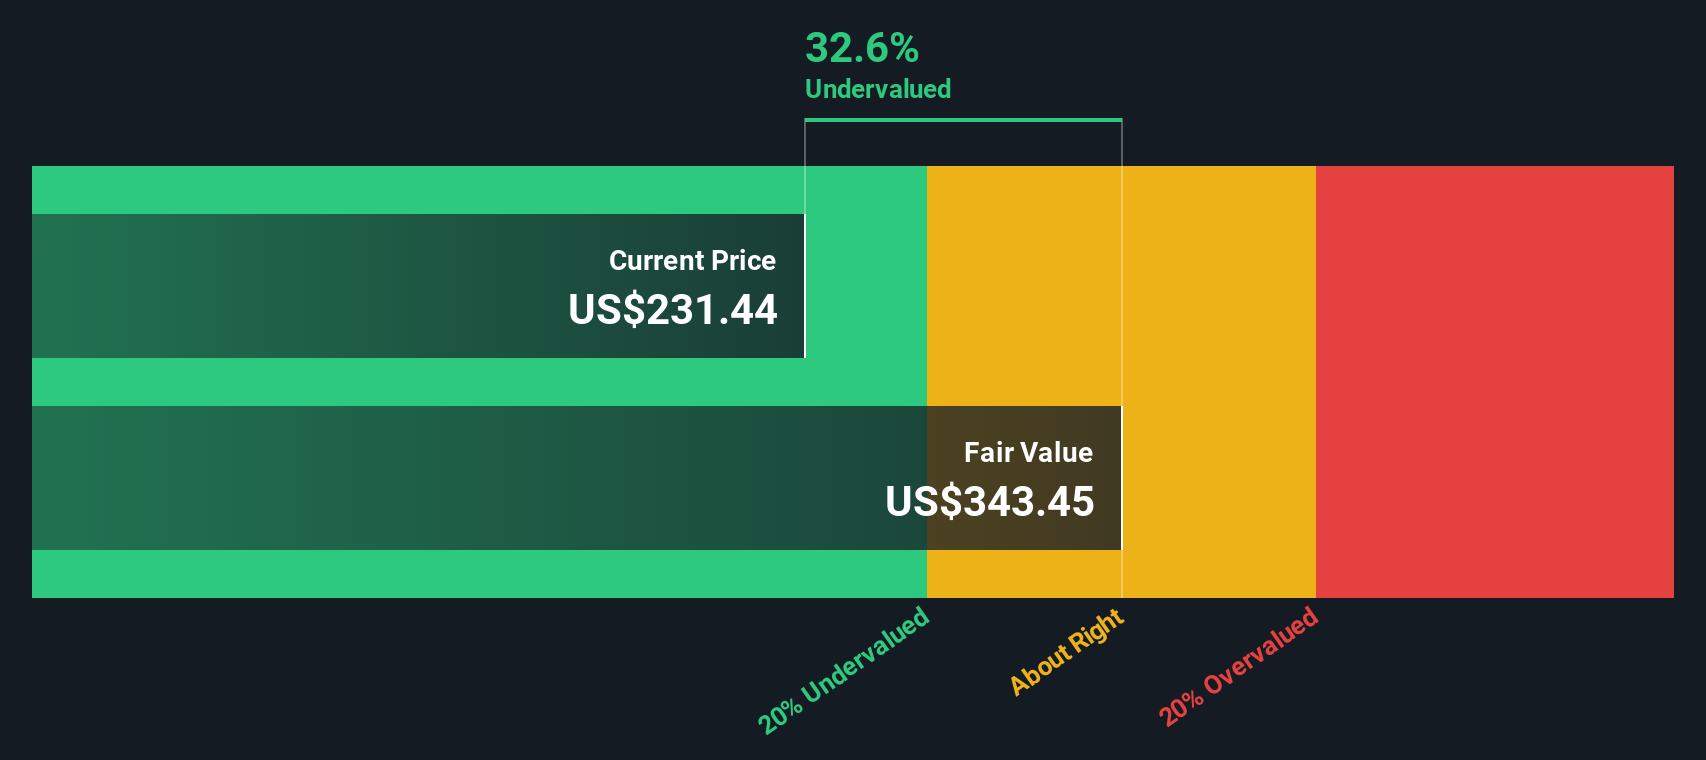
Approach 1: Amazon.com Discounted Cash Flow (DCF) Analysis
A Discounted Cash Flow model estimates what a company is worth by projecting its future cash flows and then discounting them back to today’s dollars, reflecting risk and the time value of money.
For Amazon.com, the latest twelve month free cash flow is around $40.0 billion, a level that already reflects significant scale in both e commerce and cloud. Analysts project free cash flow to grow rapidly over the next decade, reaching about $264.9 billion by 2035 based on a 2 Stage Free Cash Flow to Equity model, with earlier years anchored to analyst estimates and the outer years extrapolated by Simply Wall St.
When all those projected cash flows are discounted back to today, the model produces an intrinsic value of roughly $305.02 per share. This is about 25.1% above the current market price, which indicates that the current price may not fully reflect Amazon.com’s long term cash generation potential according to this model.
Result: UNDERVALUED
Our Discounted Cash Flow (DCF) analysis suggests Amazon.com is undervalued by 25.1%. Track this in your watchlist or portfolio, or discover 898 more undervalued stocks based on cash flows.
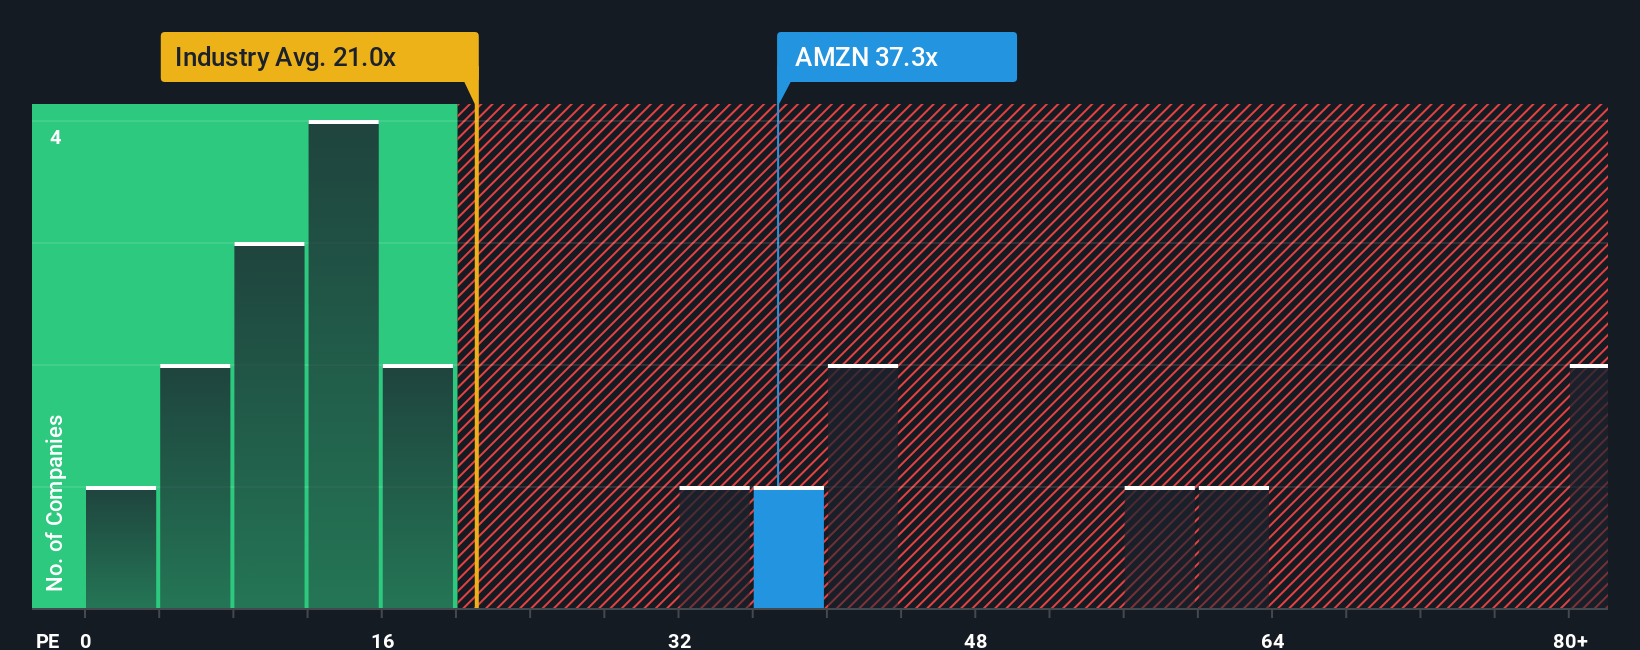
Approach 2: Amazon.com Price vs Earnings
For profitable companies like Amazon.com, the price to earnings (PE) ratio is a useful way to judge valuation because it links what investors pay today to the profits the business is already generating. In general, faster earnings growth and lower perceived risk justify a higher PE, while slower growth or higher uncertainty call for a lower, more conservative multiple.
Amazon.com currently trades on a PE of about 31.9x. That is broadly in line with its direct peer group at roughly 32.7x, but well above the wider Multiline Retail industry average of around 19.6x, reflecting Amazon.com’s growth profile and scale advantages. Simply Wall St’s proprietary Fair Ratio framework estimates a fair PE of about 40.0x for Amazon.com, based on factors such as its earnings outlook, margins, industry positioning, market capitalization and risk profile.
Because the Fair Ratio adjusts for Amazon.com’s specific trajectory and risk rather than relying on broad peer or industry comparisons, it can provide a more tailored view of what investors might be willing to pay. With the current PE of 31.9x sitting below the Fair Ratio of 40.0x, this approach suggests the shares may still be attractively priced relative to that framework.
Result: UNDERVALUED
PE ratios tell one story, but what if the real opportunity lies elsewhere? Discover 1457 companies where insiders are betting big on explosive growth.
Upgrade Your Decision Making: Choose your Amazon.com Narrative
Earlier we mentioned that there is an even better way to understand valuation, so let us introduce you to Narratives, which are simply your story about a company linked directly to the numbers you think are realistic for its future revenue, earnings, margins and fair value.
On Simply Wall St’s Community page, Narratives let you turn that story into a concrete financial forecast and a fair value estimate, so you can quickly see whether your view says Amazon.com is worth more or less than its current price and decide how that might inform a buy, hold or sell stance.
Because Narratives on the platform update dynamically when fresh information arrives, such as earnings reports or major news, your fair value view can evolve automatically as the facts change instead of remaining tied to a static snapshot.
For example, one Amazon.com Narrative might assume revenue growth near 9% a year, margins around 15% and a fair value of about $227 per share. A more optimistic Narrative could lean on higher growth and a richer multiple to reach a fair value closer to $296. Both views can coexist and be compared side by side.
For Amazon.com however we will make it really easy for you with previews of two leading Amazon.com Narratives:
Fair value: $234.75 per share
Implied discount vs last close: 2.7% undervalued
Forecast revenue growth: 13.6%
- Views the recent share price weakness after 2Q25 as an opportunity, with a long term positive outlook on Amazon’s diversified business model and execution.
- Highlights e commerce scale, AWS leadership, growing advertising, and heavy AI and data center investment as key drivers of sustained double digit revenue and earnings growth.
- Projects a 10 year upside price of around $674.07, seeing current fair value at $234.75 and treating base case return assumptions as conservative given pipeline initiatives.
Fair value: $227.14 per share
Implied premium vs last close: 0.5% overvalued
Forecast revenue growth: 9.0%
- Frames Amazon as a two sided business, with high margin AWS, advertising and subscriptions offset by structurally low margin, high volume retail operations.
- Assumes the high margin segments can sustain 15% plus annual growth and 30 to 40% margins, while the retail side grows 5 to 10% with margins below 5%.
- Sees Amazon reaching about $1 trillion in revenue and $150 billion in earnings in 5 years, but with a fair value near $227.14, implying limited upside from the current share price.
Do you think there's more to the story for Amazon.com? Head over to our Community to see what others are saying!
This article by Simply Wall St is general in nature. We provide commentary based on historical data and analyst forecasts only using an unbiased methodology and our articles are not intended to be financial advice. It does not constitute a recommendation to buy or sell any stock, and does not take account of your objectives, or your financial situation. We aim to bring you long-term focused analysis driven by fundamental data. Note that our analysis may not factor in the latest price-sensitive company announcements or qualitative material. Simply Wall St has no position in any stocks mentioned.
Have feedback on this article? Concerned about the content? Get in touch with us directly. Alternatively, email editorial-team@simplywallst.com