
- PREMIUM
- LIVE QUOTES
- INSTITUTIONS
 Index Options
 State Street
 CME Group
 Nasdaq
 Cboe
Cboe TradingView
 Wall Street Journal
Does Johnson & Johnson’s 2025 Rally Still Offer Value After Strong DCF and PE Signals?
- Wondering if Johnson & Johnson is still a buy at around $206 a share, or if the easy gains are already behind it? This breakdown will help you decide whether the current price matches the company’s long term fundamentals.
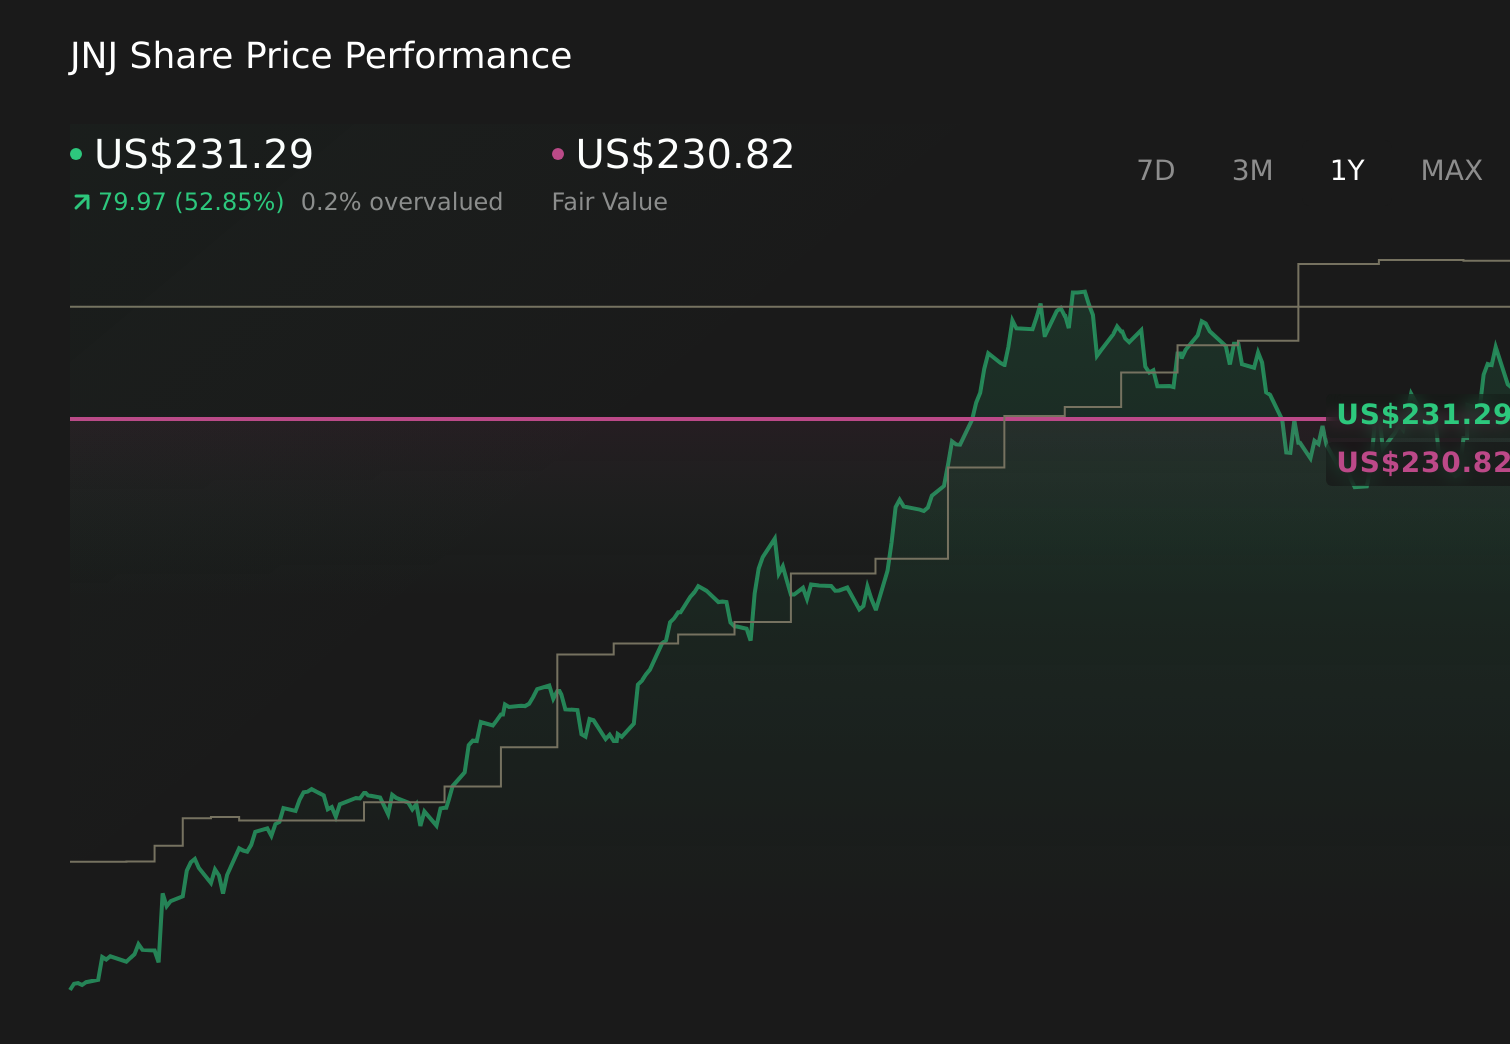
- Despite a recent dip of 3.6% over the last week, the stock is still up 1.2% over the past month, 43.3% year to date and 46.4% over the last year, which indicates the market has been steadily re-rating J&J’s prospects.
- That momentum has been shaped by a stream of news, from ongoing product pipeline updates and regulatory milestones to continued progress in spinning off non core operations and sharpening its focus on higher growth healthcare segments. Together, these developments have influenced how investors weigh J&J’s defensive stability against its future growth runway.
- On our framework, Johnson & Johnson scores a 4/6 valuation score, suggesting it looks undervalued on several key checks. Next we will unpack what that means across different valuation methods, before exploring an even deeper way to think about its true worth.
Approach 1: Johnson & Johnson Discounted Cash Flow (DCF) Analysis
A Discounted Cash Flow model estimates what a company is worth today by projecting the cash it can generate in the future and then discounting those cash flows back to a present value.
For Johnson & Johnson, the latest twelve month Free Cash Flow is about $19.5 billion. This forms the starting point for the 2 Stage Free Cash Flow to Equity model. Analysts provide detailed forecasts for the next few years. Beyond that, Simply Wall St extrapolates the trend, with FCF projected to reach roughly $33.0 billion by 2029 and continue growing into the mid 2030s. These projected cash flows, all in $, are then discounted back to today to account for risk and the time value of money.
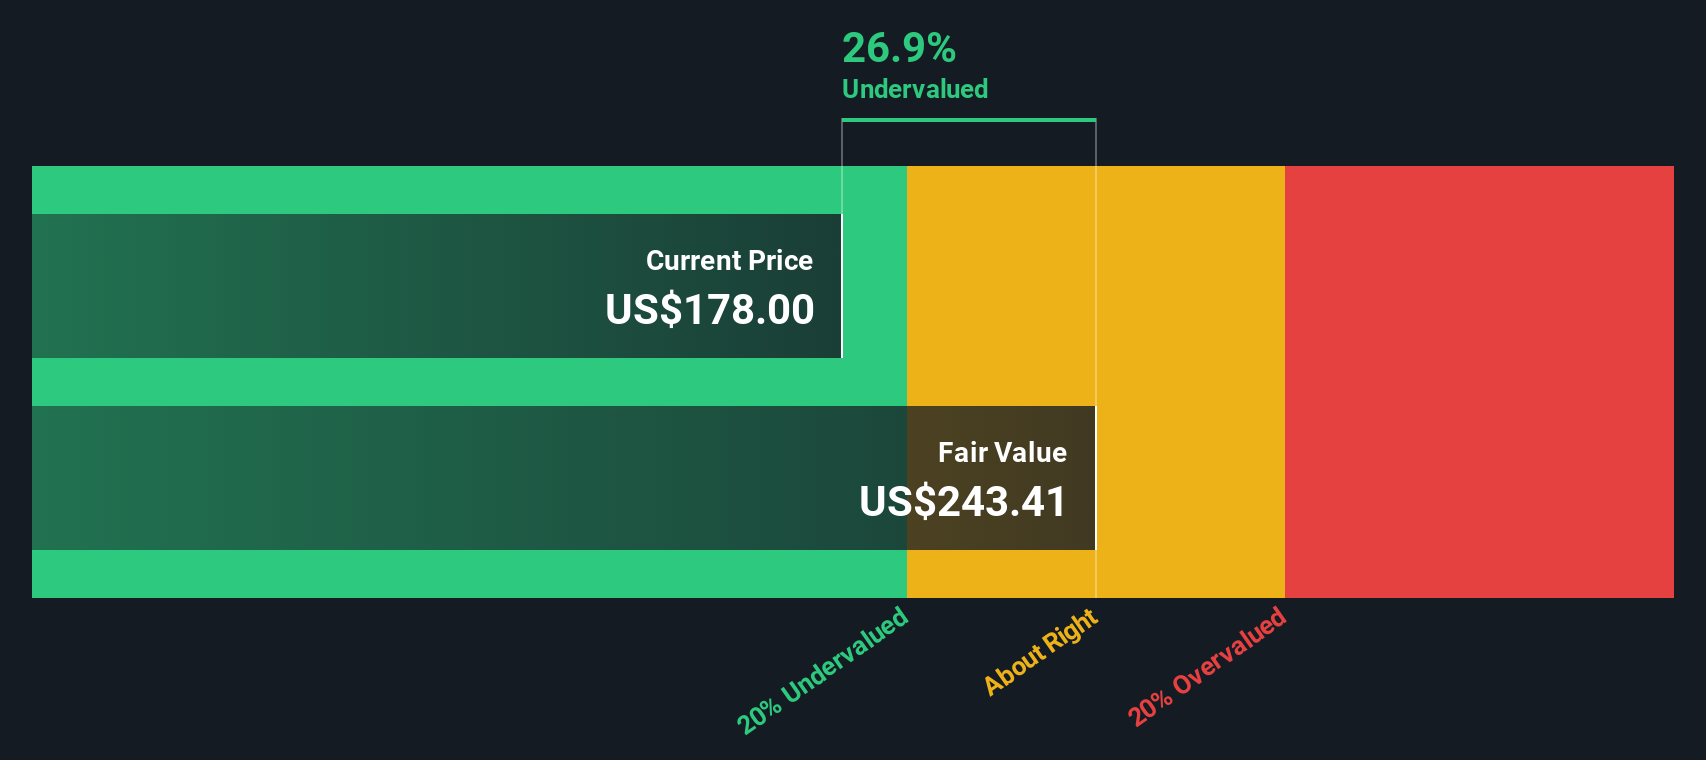
On this basis, the DCF model arrives at an estimated intrinsic value of roughly $384 per share. Compared with the current share price around $206, this indicates the stock is about 46.3% undervalued according to this model.
Result: UNDERVALUED
Our Discounted Cash Flow (DCF) analysis suggests Johnson & Johnson is undervalued by 46.3%. Track this in your watchlist or portfolio, or discover 909 more undervalued stocks based on cash flows.
Approach 2: Johnson & Johnson Price vs Earnings
For a mature, consistently profitable business like Johnson & Johnson, the Price to Earnings (PE) ratio is a practical way to assess valuation because it links what investors pay today to the earnings the company is already generating.
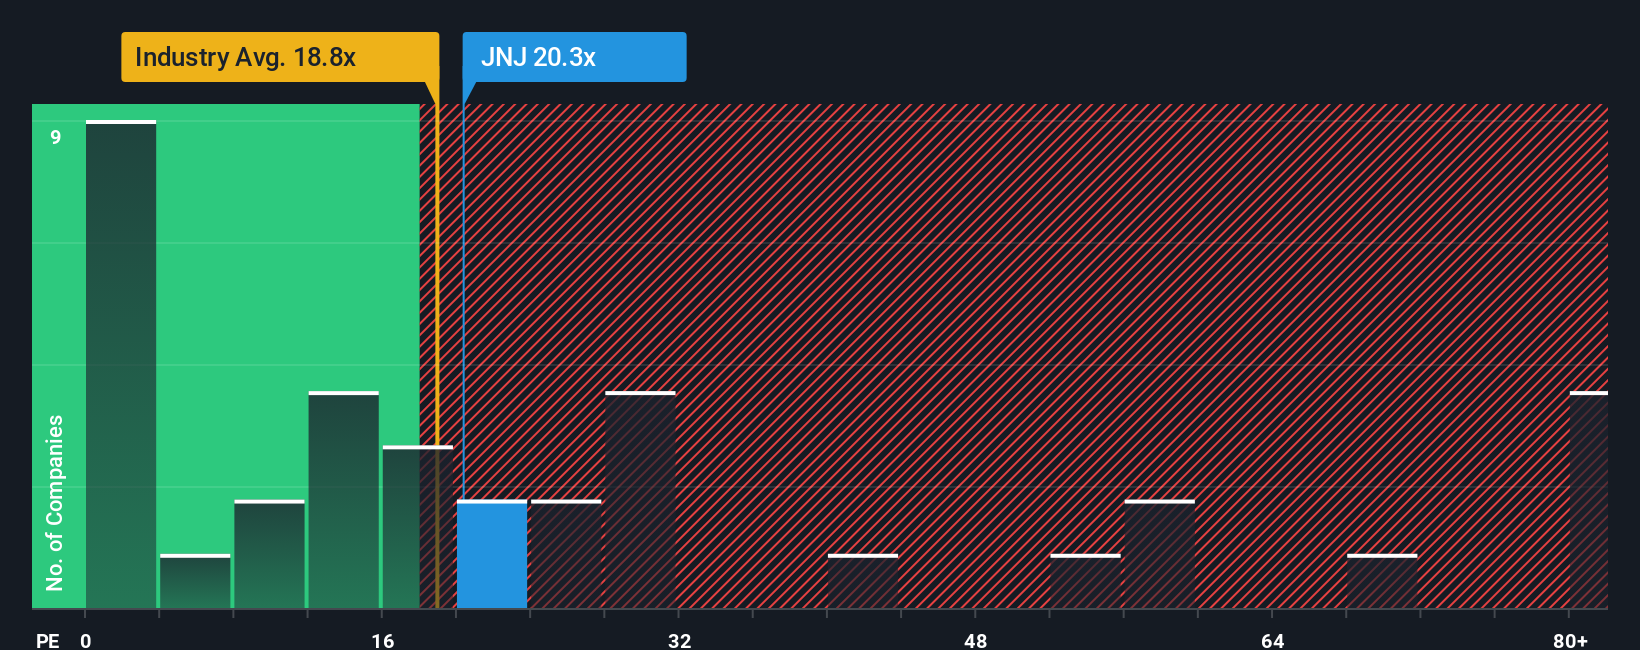
In general, faster growth and lower perceived risk support a higher PE ratio, while slower growth and higher uncertainty call for a lower one. J&J currently trades on a PE of about 19.8x, broadly in line with the wider Pharmaceuticals industry average of roughly 19.8x, and below the peer group average of about 24.5x, which suggests the market is applying a modest discount versus comparable large cap healthcare names.
Simply Wall St’s Fair Ratio framework goes a step further by estimating what PE J&J should trade on, once factors like its earnings growth outlook, profit margins, risk profile, industry and market cap are accounted for. On this basis, J&J’s Fair Ratio is about 29.7x, well above the current 19.8x, which implies the market is not fully recognizing the company’s earnings quality and growth potential.
Result: UNDERVALUED
PE ratios tell one story, but what if the real opportunity lies elsewhere? Discover 1460 companies where insiders are betting big on explosive growth.
Upgrade Your Decision Making: Choose your Johnson & Johnson Narrative
Earlier we mentioned that there is an even better way to understand valuation, so let us introduce you to Narratives. This is a simple tool on Simply Wall St’s Community page that lets you connect your view of Johnson & Johnson’s story to a specific forecast for its future revenue, earnings and margins, and then to a fair value that you can easily compare with today’s share price to help you decide whether to buy, hold or sell.
A Narrative is your investment story made explicit. It turns your assumptions about things like portfolio separation, litigation risks and pipeline strength into numbers that drive a dynamic fair value, which then updates automatically as new information such as earnings, product news or legal developments comes in.
For example, one Johnson & Johnson Narrative on the platform might assume that portfolio reshaping and next generation therapies support revenue growth above 5% a year and a future PE near 25x. This could lead to a fair value comfortably above the current price. Another, more cautious Narrative could focus on tariff headwinds, loss of exclusivity and litigation uncertainty, bake in slower growth and lower margins, and conclude that a fair value closer to the low 200s means limited upside at today’s level.
Do you think there's more to the story for Johnson & Johnson? Head over to our Community to see what others are saying!
This article by Simply Wall St is general in nature. We provide commentary based on historical data and analyst forecasts only using an unbiased methodology and our articles are not intended to be financial advice. It does not constitute a recommendation to buy or sell any stock, and does not take account of your objectives, or your financial situation. We aim to bring you long-term focused analysis driven by fundamental data. Note that our analysis may not factor in the latest price-sensitive company announcements or qualitative material. Simply Wall St has no position in any stocks mentioned.
Have feedback on this article? Concerned about the content? Get in touch with us directly. Alternatively, email editorial-team@simplywallst.com