
Is AstraZeneca Still Attractive After Its Strong 2025 Run and Pipeline Expansion?
- If you are wondering whether AstraZeneca is still worth buying after its big pharma run up, or if the real upside is already priced in, you are not alone. This breakdown is designed to help you cut through the noise.
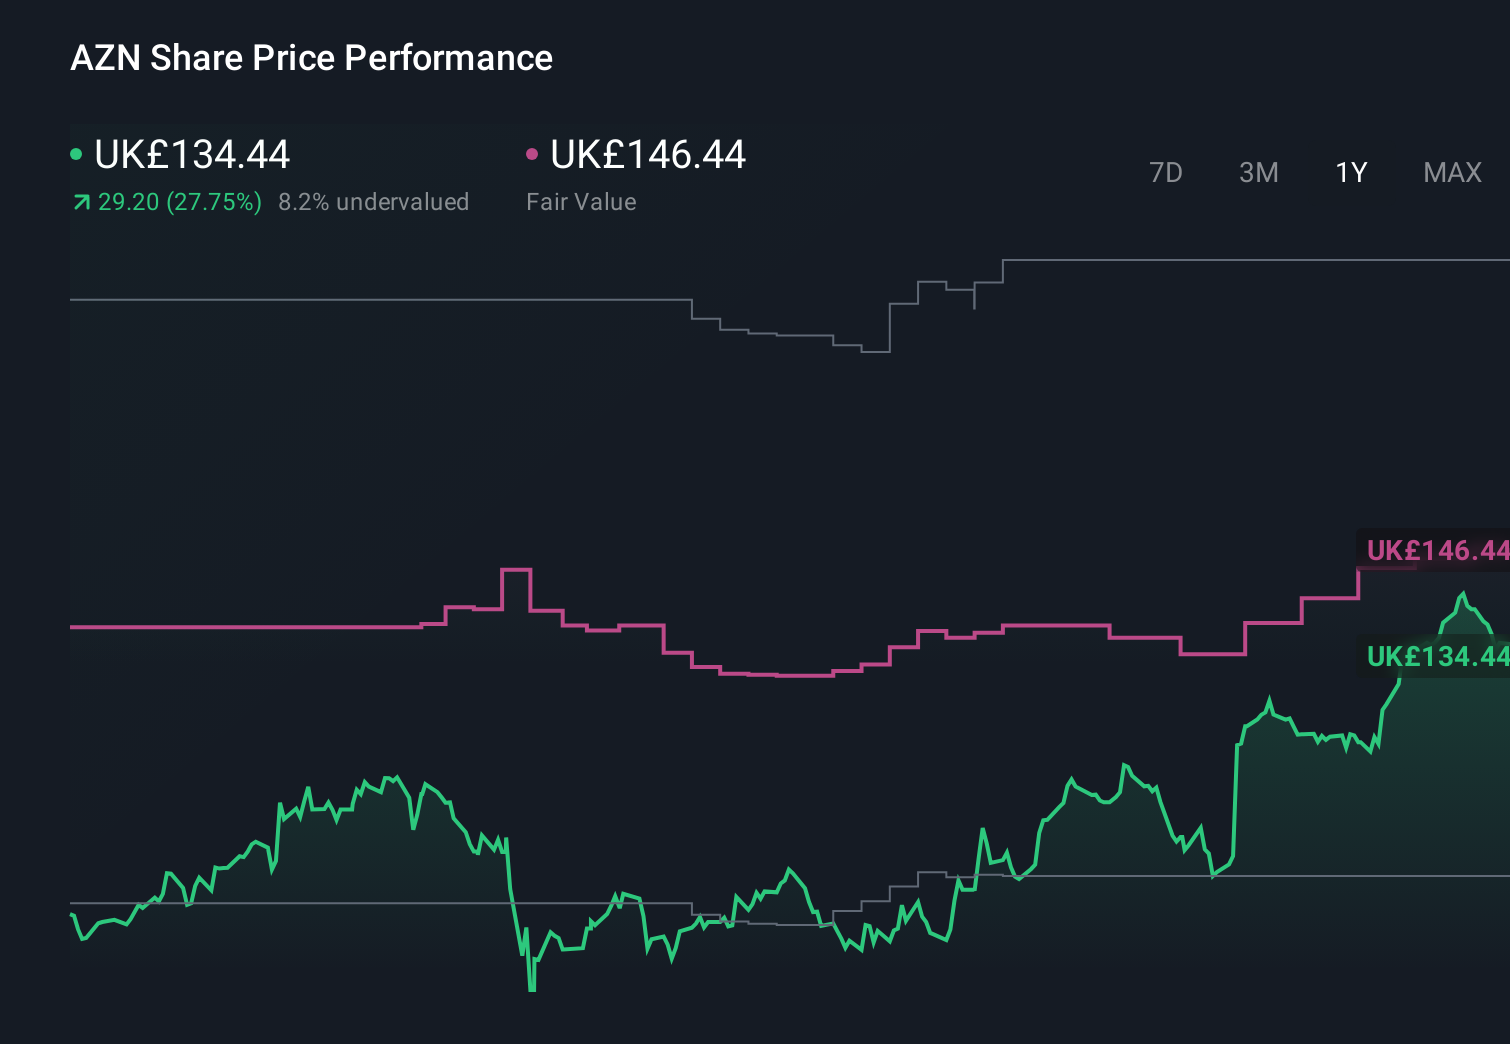
- The stock has eased slightly in the last week, down around 0.4%, and is roughly flat over the last month. It is still up about 27.5% year to date and roughly 110.3% over 5 years, which provides a strong backdrop for a valuation check.
- Recent headlines have focused on AstraZeneca doubling down on its pipeline, from oncology combinations to respiratory treatments and next generation vaccines. This keeps long term growth expectations alive even as the share price cools off a bit. The market is essentially weighing how much of that future drug upside is already reflected in today’s 135.48 share price.
- On our valuation framework, AstraZeneca scores 3 out of 6 on undervaluation checks. You can see the detailed breakdown in this valuation score. Next, we will walk through the main valuation approaches investors use for a stock like this before finishing with a more holistic way to judge whether it represents genuinely good value.
Approach 1: AstraZeneca Discounted Cash Flow (DCF) Analysis
A Discounted Cash Flow model estimates what a company is worth by projecting its future cash flows and discounting them back to today in order to reflect risk and the time value of money.
For AstraZeneca, the latest twelve month free cash flow is about $10.2 billion, and analysts expect this to rise steadily as key drugs and the broader pipeline mature. On Simply Wall St’s two stage Free Cash Flow to Equity model, cash flows are projected out over the next decade, with analyst forecasts used for the first few years and then extrapolated growth thereafter. By 2029, free cash flow is expected to reach roughly $19.1 billion, with further moderate expansion assumed toward 2035.
When these projected cash flows are discounted back to today, the model arrives at an intrinsic value of about $236.97 per share. Compared with the current share price of roughly £135.48, this implies AstraZeneca is trading at a 42.8% discount to its DCF fair value. This indicates that the shares may currently be priced below the value suggested by the model’s cash flow assumptions.
Result: UNDERVALUED
Our Discounted Cash Flow (DCF) analysis suggests AstraZeneca is undervalued by 42.8%. Track this in your watchlist or portfolio, or discover 916 more undervalued stocks based on cash flows.

Approach 2: AstraZeneca Price vs Earnings
For profitable companies like AstraZeneca, the Price to Earnings ratio is a useful way to gauge value because it links what investors pay today with the profits the business is already generating. A higher or lower PE can be justified depending on how quickly earnings are expected to grow and how risky or cyclical those earnings are. As a result, growth expectations and perceived risk largely determine what a normal or fair PE should be.
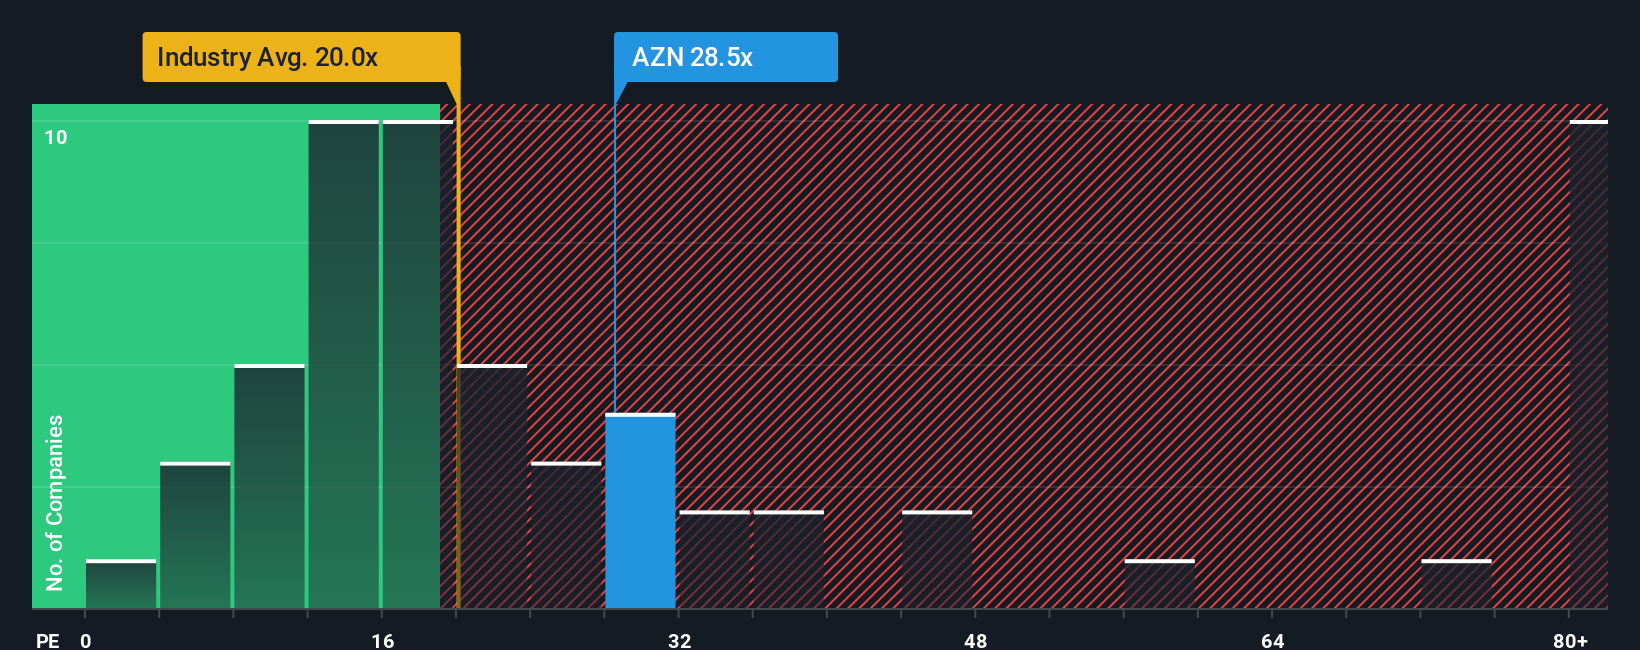
AstraZeneca currently trades on a PE of about 29.9x, which is higher than the Pharmaceuticals industry average of roughly 22.3x and also above the peer group average of around 13.0x. At first glance this premium might suggest the shares are expensive, but it does not fully account for AstraZeneca’s specific growth profile, margins, scale and risk.
This is where Simply Wall St’s Fair Ratio comes in. The Fair PE Ratio for AstraZeneca is estimated at about 30.9x, a proprietary measure that incorporates the company’s earnings growth outlook, profitability, industry, market cap and risk factors. Because it is tailored to the company rather than based on broad peer or sector averages, it offers a more nuanced benchmark. With the actual PE of 29.9x sitting slightly below the 30.9x Fair Ratio, AstraZeneca screens as modestly undervalued on this metric.
Result: UNDERVALUED
PE ratios tell one story, but what if the real opportunity lies elsewhere? Discover 1458 companies where insiders are betting big on explosive growth.
Upgrade Your Decision Making: Choose your AstraZeneca Narrative
Earlier we mentioned that there is an even better way to understand valuation, so let us introduce you to Narratives, which are simple, story driven forecasts where you describe how you think AstraZeneca’s business will evolve, translate that story into expectations for future revenue, earnings and margins, and then see the fair value that falls out of those assumptions.
A Narrative links three things together: the company’s story, a quantified financial forecast and a resulting fair value. On Simply Wall St’s Community page, millions of investors use these Narratives as an easy, accessible tool to decide whether to buy or sell by comparing their Narrative Fair Value to today’s share price.
Because Narratives are updated dynamically as new information like earnings reports, pipeline news or policy changes arrives, you can quickly see how your fair value view should shift. With AstraZeneca, that might mean one investor builds a bullish Narrative around strong oncology execution, US manufacturing expansion and a fair value near the top end of current estimates, while another focuses on patent cliffs, pricing pressure and regulatory risk to justify a much lower fair value near the bottom of the range.
Do you think there's more to the story for AstraZeneca? Head over to our Community to see what others are saying!
This article by Simply Wall St is general in nature. We provide commentary based on historical data and analyst forecasts only using an unbiased methodology and our articles are not intended to be financial advice. It does not constitute a recommendation to buy or sell any stock, and does not take account of your objectives, or your financial situation. We aim to bring you long-term focused analysis driven by fundamental data. Note that our analysis may not factor in the latest price-sensitive company announcements or qualitative material. Simply Wall St has no position in any stocks mentioned.
Have feedback on this article? Concerned about the content? Get in touch with us directly. Alternatively, email editorial-team@simplywallst.com