
Has Dutch Bros Recent Share Price Surge Left Limited Upside in 2025?
- If you are wondering whether Dutch Bros is still a smart buy after its big run, or if you would just be paying up for hype, this is a good place to unpack what the market might be missing on value.
- The stock has climbed 3.3% over the last week, 22.1% over the past month, and is up 22.9% in the last year, compounding into a 108.8% gain over three years that has investors rethinking both its growth potential and risk profile.
- Recent attention has focused on Dutch Bros rapid store expansion strategy and its push into new markets across the United States, which some investors view as a key driver of long term growth. In addition, commentary around the brand's customer loyalty and drive thru focused model has supported optimism that it can continue taking share from larger beverage chains.
- Despite that optimism, Dutch Bros currently scores just 1/6 on our valuation checks, suggesting the market may already be pricing in a lot of good news, or possibly missing a more nuanced story. Next, we will walk through the standard valuation approaches that lead to this score, and then return to a broader way of thinking about what the stock may be worth.
Dutch Bros scores just 1/6 on our valuation checks. See what other red flags we found in the full valuation breakdown.
Approach 1: Dutch Bros Discounted Cash Flow (DCF) Analysis
A Discounted Cash Flow model estimates what a business is worth today by projecting its future cash flows and then discounting those dollars back to their value in the present.
For Dutch Bros, the latest twelve month free cash flow is slightly negative at about $6 million, highlighting that the company is still in an investment heavy phase. Analysts expect this to flip meaningfully, with free cash flow forecast to reach roughly $80 million by 2026. Simply Wall St then extrapolates those projections out over the following decade to capture the longer term growth story.
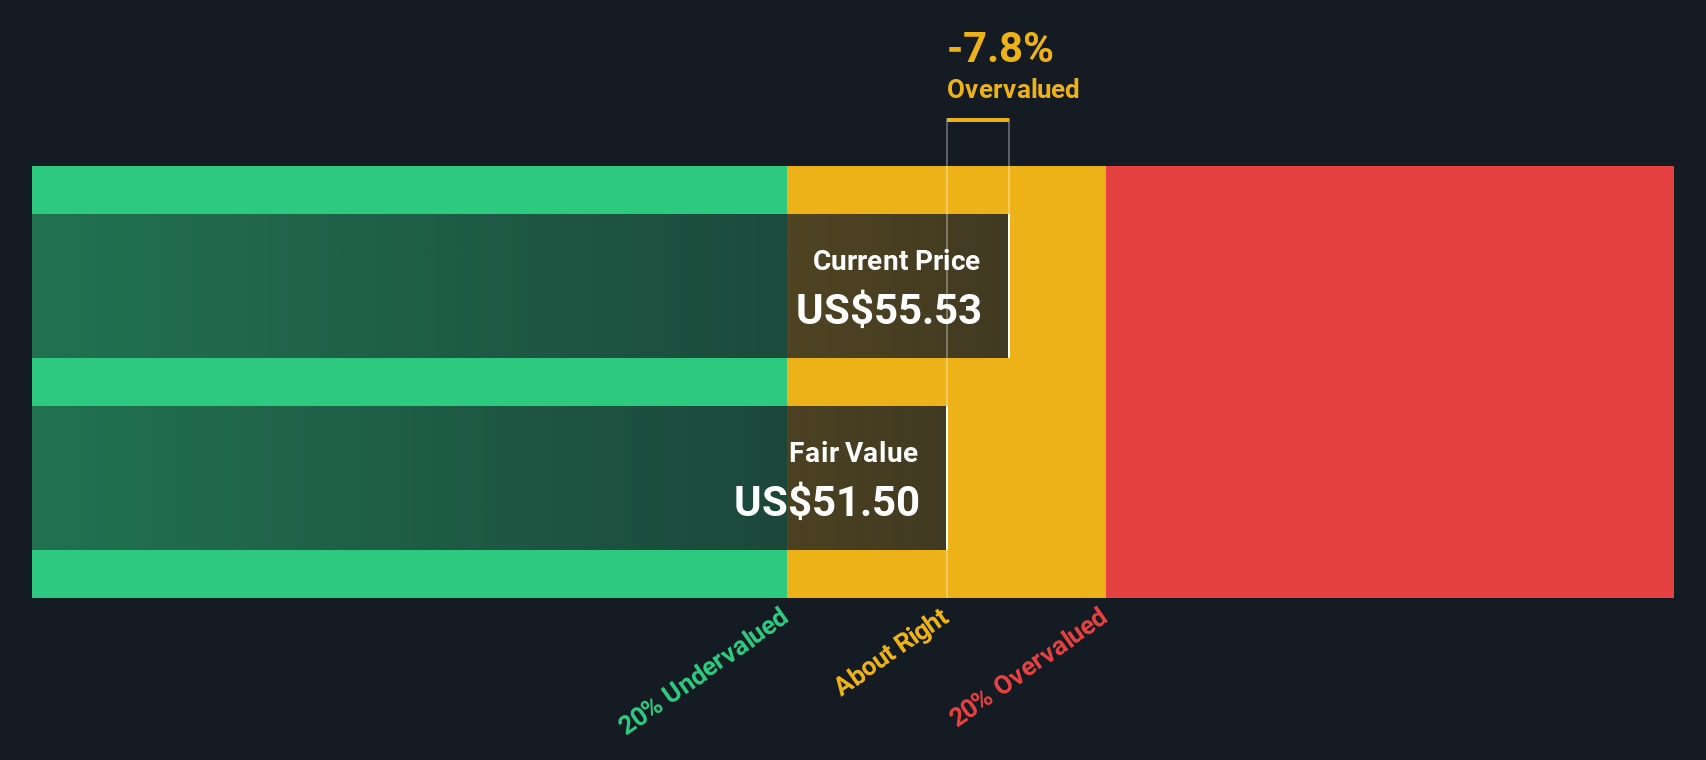
Using a two stage Free Cash Flow to Equity model, these future cash flows are discounted back to today to arrive at an estimated intrinsic value of about $46.40 per share. Compared with the current share price, this implies the stock is roughly 35.8% overvalued on a pure cash flow basis, which suggests the market is paying a premium for its growth runway.
Result: OVERVALUED
Our Discounted Cash Flow (DCF) analysis suggests Dutch Bros may be overvalued by 35.8%. Discover 913 undervalued stocks or create your own screener to find better value opportunities.
Approach 2: Dutch Bros Price vs Earnings
For profitable companies, the price to earnings, or PE, ratio is a useful way to gauge how much investors are willing to pay today for each dollar of current earnings. It naturally compares price with a business outcome that shareholders ultimately care about, profit.
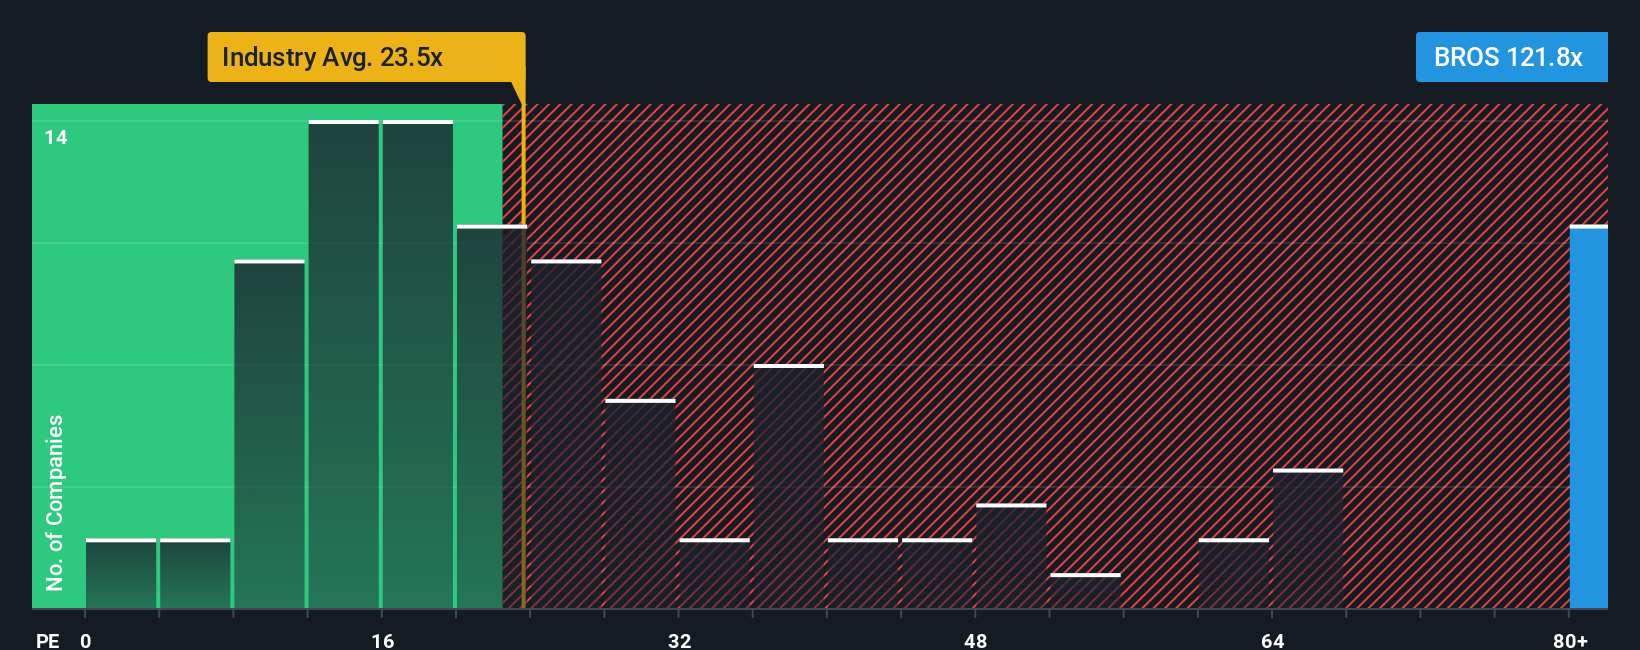
What counts as a fair PE depends on how quickly earnings are expected to grow and how risky that growth looks. Faster, more reliable growers usually justify higher PE ratios, while slower or riskier businesses tend to trade on lower multiples. Dutch Bros currently trades on a lofty PE of about 128.9x, well above the broader hospitality industry average of roughly 23.8x and above its peer group average of around 29.0x.
Simply Wall St’s Fair Ratio framework estimates that, given Dutch Bros specific growth outlook, profitability profile, industry positioning and risks, a more appropriate PE would be closer to 35.7x. This Fair Ratio is more informative than a simple peer or industry comparison because it explicitly adjusts for those company specific factors rather than assuming all hospitality stocks deserve similar valuations. With the actual PE sitting far above the Fair Ratio, the multiple based view points to Dutch Bros being meaningfully overvalued at current levels.
Result: OVERVALUED
PE ratios tell one story, but what if the real opportunity lies elsewhere? Discover 1454 companies where insiders are betting big on explosive growth.
Upgrade Your Decision Making: Choose your Dutch Bros Narrative
Earlier we mentioned that there is an even better way to understand valuation, so let us introduce Narratives, a simple way for you to connect your view of Dutch Bros with the numbers by turning your story about its future growth, margins and risks into a financial forecast, a Fair Value, and ultimately a buy or sell decision.
On Simply Wall St, Narratives live on the Community page and are used by millions of investors as an easy, visual tool to outline what they think will happen to a company, link those assumptions to projected revenue, earnings and profit margins, and then compare the resulting Fair Value to today’s share price to decide whether a stock looks attractive or stretched.
Because Narratives are dynamically updated whenever new information like earnings releases, guidance changes or major news arrives, they help you quickly see whether your thesis still holds, and they make it clear how different perspectives can coexist. For example, one Dutch Bros Narrative might point to a higher Fair Value around the most bullish $92 target, while another, more cautious view is anchored closer to the $73 bear case.
Do you think there's more to the story for Dutch Bros? Head over to our Community to see what others are saying!

This article by Simply Wall St is general in nature. We provide commentary based on historical data and analyst forecasts only using an unbiased methodology and our articles are not intended to be financial advice. It does not constitute a recommendation to buy or sell any stock, and does not take account of your objectives, or your financial situation. We aim to bring you long-term focused analysis driven by fundamental data. Note that our analysis may not factor in the latest price-sensitive company announcements or qualitative material. Simply Wall St has no position in any stocks mentioned.
Have feedback on this article? Concerned about the content? Get in touch with us directly. Alternatively, email editorial-team@simplywallst.com