
- PREMIUM
- LIVE QUOTES
- INSTITUTIONS
 Index Options
 State Street
 CME Group
 Nasdaq
 Cboe
Cboe TradingView
 Wall Street Journal
Does Tyson Foods Offer Value After Recent Cost Cutting and Share Price Rebound?
- Wondering whether Tyson Foods is quietly turning into a value opportunity or just another range bound staple stock? Let us unpack what the recent moves and fundamentals are really telling us about TSN.
- After drifting for a while, Tyson shares now sit around $58.50, down about 1.8% over the last week but still up roughly 9.0% over the past month and modestly positive year to date with a 4.1% gain over the last year.
- Recent attention has centered on Tyson's ongoing efficiency push, including cost saving initiatives and a continued reshaping of its poultry and prepared foods operations. At the same time, macro headlines around food price inflation, shifting consumer demand, and protein export dynamics are shaping how investors think about both its risks and growth path.
- On our scorecard, Tyson Foods earns a valuation score of 2/6, reflecting that it screens as undervalued on only two of six key checks. We will walk through what different valuation methods say, and then finish with a more holistic way to think about fair value that goes beyond the usual ratios.
Tyson Foods scores just 2/6 on our valuation checks. See what other red flags we found in the full valuation breakdown.
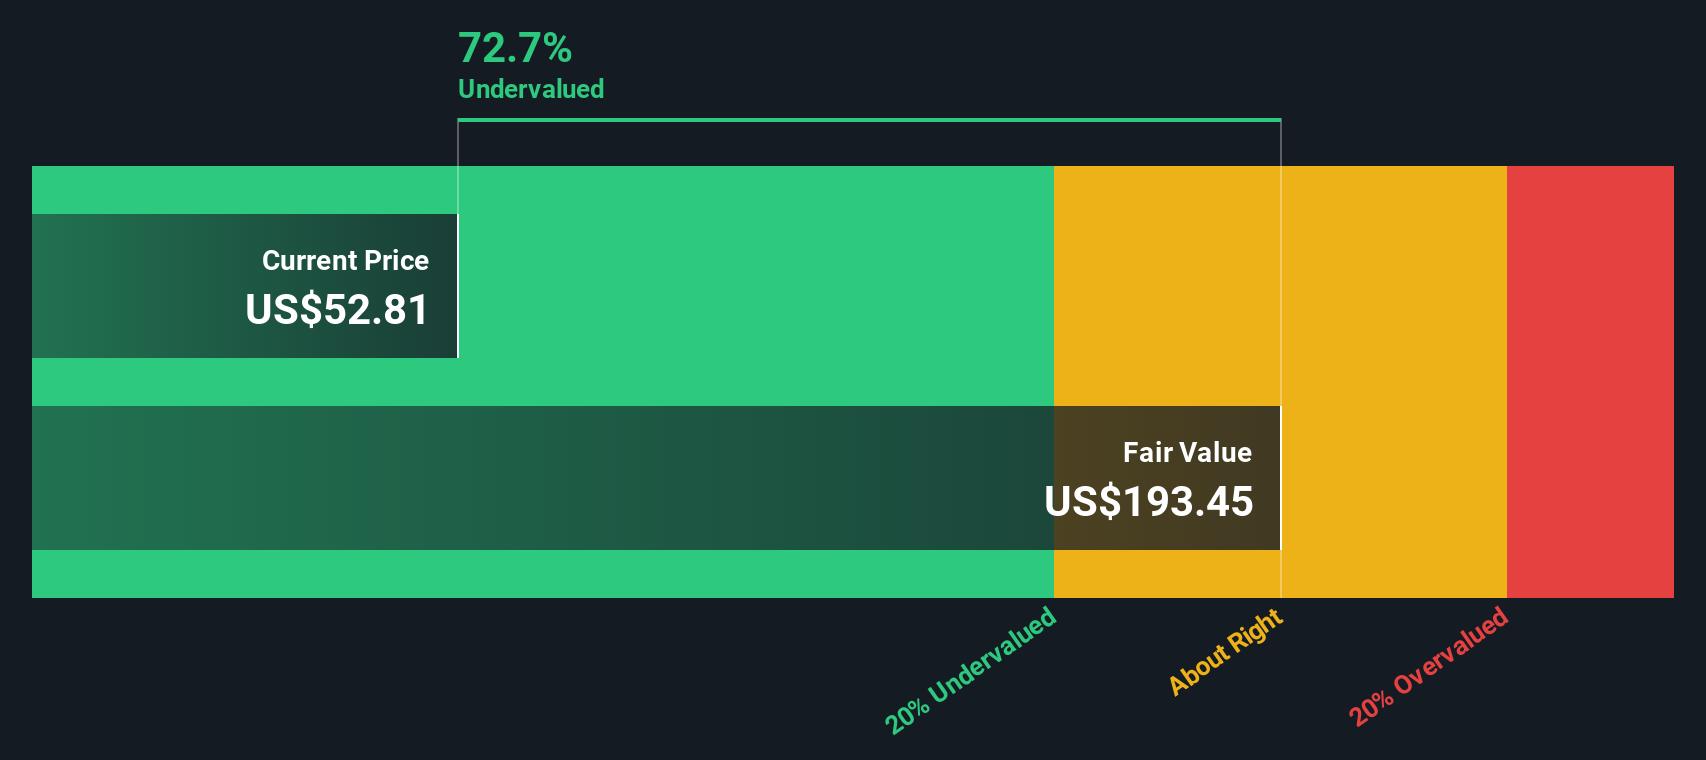
Approach 1: Tyson Foods Discounted Cash Flow (DCF) Analysis
A Discounted Cash Flow, or DCF, model projects a company’s future cash flows and then discounts them back to today’s dollars to estimate what the business is worth now.
For Tyson Foods, the latest twelve months Free Cash Flow is about $780 million. Analysts and extrapolated estimates used in this 2 stage Free Cash Flow to Equity model see FCF rising to roughly $1.60 billion by 2035, with interim projections such as $1.19 billion in 2026 and $1.34 billion in 2028. Simply Wall St uses explicit analyst forecasts for the next few years, and then gradually tapers growth assumptions to extend the cash flow curve over the following decade.
When all those projected cash flows are discounted back to today, the model arrives at an intrinsic value of about $92.58 per share, implying Tyson trades at roughly a 36.8% discount to its estimated fair value at current prices near the high 50s. On this cash flow view, the market is giving investors a sizable margin of safety.
Result: UNDERVALUED
Our Discounted Cash Flow (DCF) analysis suggests Tyson Foods is undervalued by 36.8%. Track this in your watchlist or portfolio, or discover 913 more undervalued stocks based on cash flows.
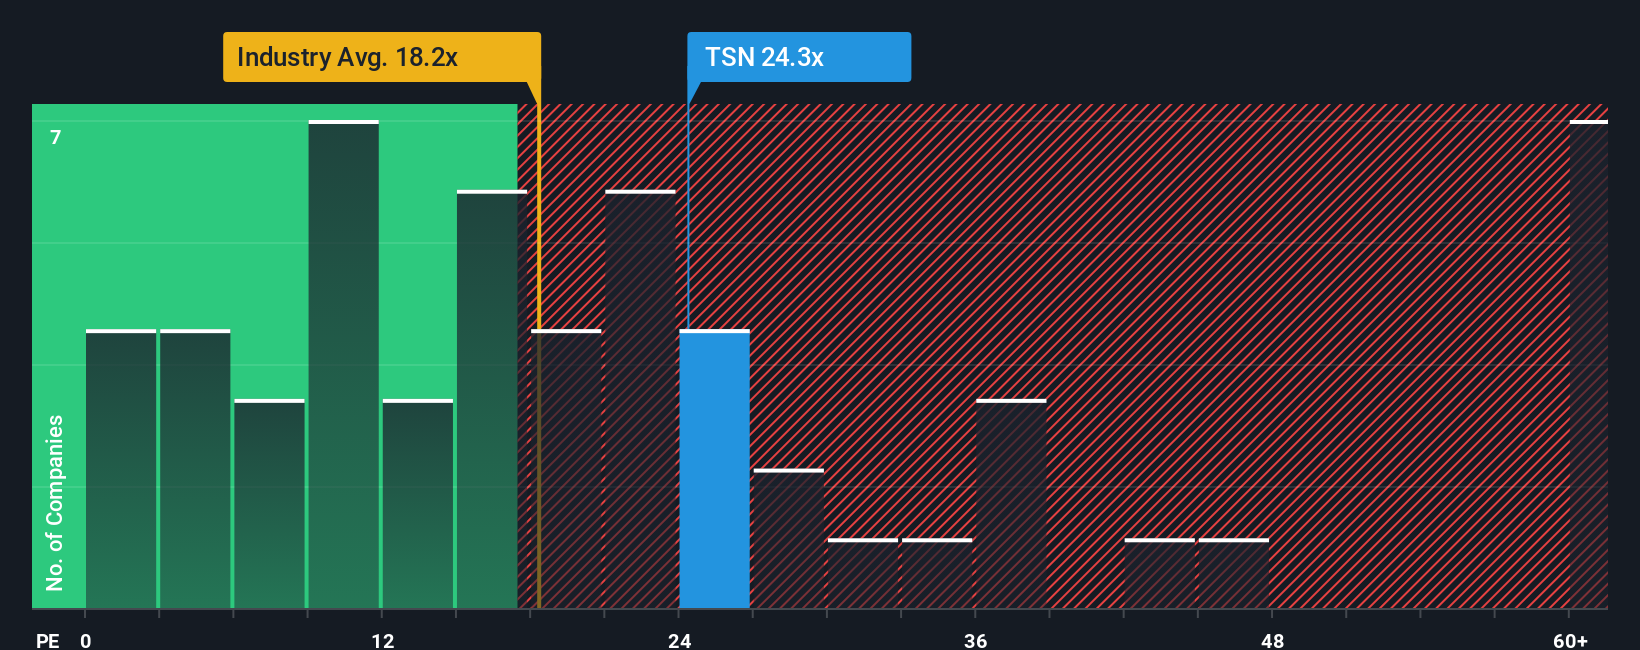
Approach 2: Tyson Foods Price vs Earnings
For profitable companies like Tyson Foods, the price to earnings ratio, or PE, is a useful way to see how much investors are paying for each dollar of current earnings. It effectively wraps the market’s expectations for future growth and risk into a single number, with higher growth and lower perceived risk usually supporting a higher, or more expensive, PE multiple.
Tyson currently trades on a PE of about 43.6x, which is well above both the Food industry average of roughly 19.8x and the broader peer group average of around 16.9x. On those simple comparisons, the stock looks expensive. However, Simply Wall St also calculates a proprietary Fair Ratio of 28.9x, which is the PE you might expect for Tyson given its specific mix of earnings growth prospects, industry dynamics, profit margins, market cap and risk profile.
This Fair Ratio is more tailored than basic peer or industry comparisons, because it adjusts for Tyson’s own fundamentals rather than assuming it should trade like the average food company. Comparing the current 43.6x PE to the 28.9x Fair Ratio suggests the market is pricing in more optimism than those fundamentals justify.
Result: OVERVALUED
PE ratios tell one story, but what if the real opportunity lies elsewhere? Discover 1454 companies where insiders are betting big on explosive growth.
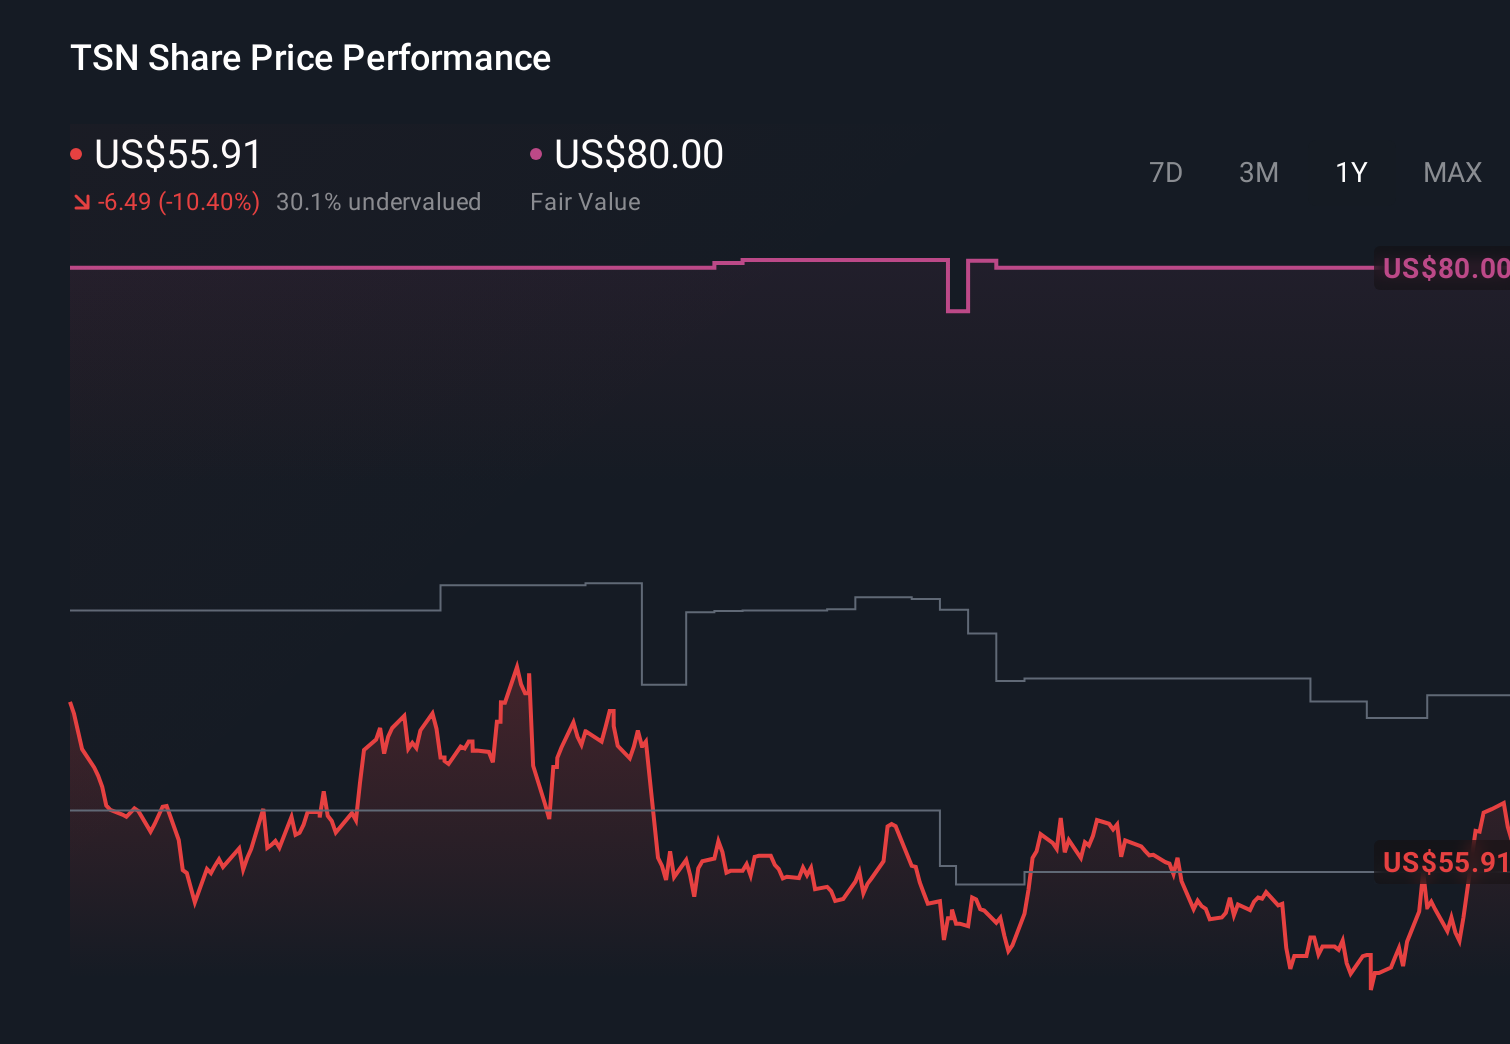
Upgrade Your Decision Making: Choose your Tyson Foods Narrative
Earlier we mentioned that there is an even better way to understand valuation. Let us introduce you to Narratives, a simple tool on Simply Wall St’s Community page that lets you turn your view of Tyson Foods into a clear story that links assumptions about future revenue, earnings and margins to a forecast, then to a fair value. You can quickly see whether the current price makes Tyson a buy or a sell, while the platform dynamically refreshes that fair value as new news and earnings arrive. For example, a bullish investor might build a narrative that leans toward the higher end of recent targets around $80 per share based on stronger margin expansion and global protein demand. A more cautious investor could anchor closer to the lower end near $55 per share to reflect beef supply issues, input cost risks and flat volumes, with both perspectives transparently quantified and easy to compare against today’s market price.
Do you think there's more to the story for Tyson Foods? Head over to our Community to see what others are saying!
This article by Simply Wall St is general in nature. We provide commentary based on historical data and analyst forecasts only using an unbiased methodology and our articles are not intended to be financial advice. It does not constitute a recommendation to buy or sell any stock, and does not take account of your objectives, or your financial situation. We aim to bring you long-term focused analysis driven by fundamental data. Note that our analysis may not factor in the latest price-sensitive company announcements or qualitative material. Simply Wall St has no position in any stocks mentioned.
Have feedback on this article? Concerned about the content? Get in touch with us directly. Alternatively, email editorial-team@simplywallst.com