
- PREMIUM
- LIVE QUOTES
- INSTITUTIONS
 Index Options
 State Street
 CME Group
 Nasdaq
 Cboe
Cboe TradingView
 Wall Street Journal
Is Berkshire Hathaway Still Attractively Priced After Strong 5 Year Share Price Gains?
- If you are wondering whether Berkshire Hathaway is still a smart buy at these lofty absolute prices, or if most of the value has already been squeezed out, you are not alone.
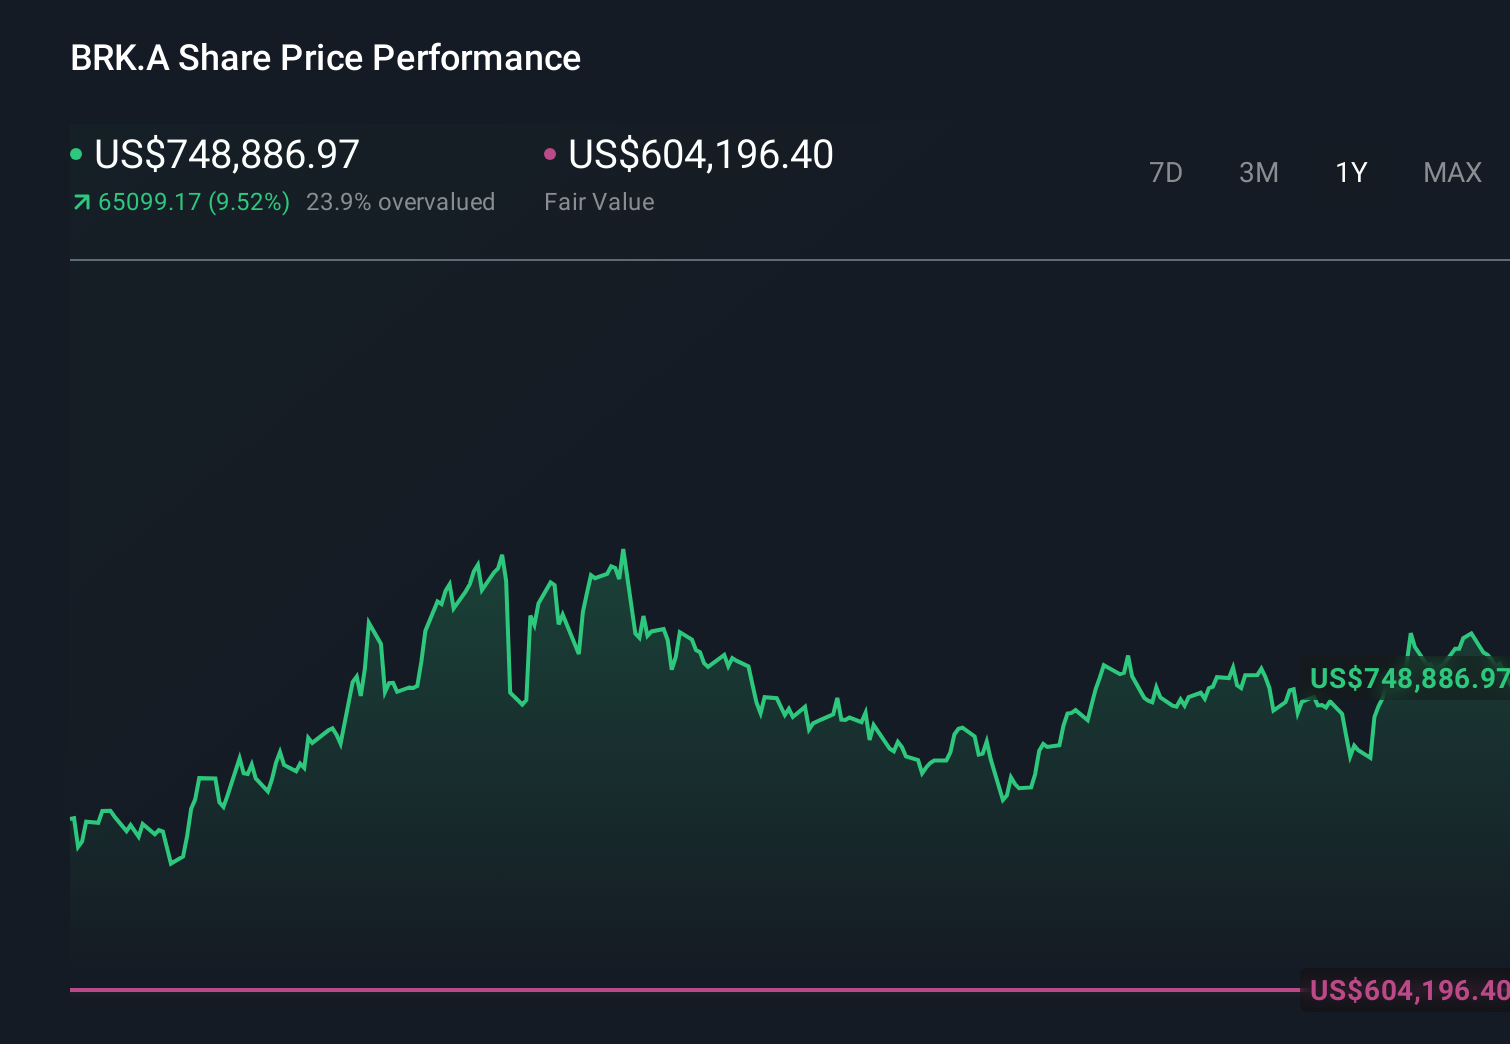
- The stock has edged up about 1.8% over the last week and roughly 0.1% over the past month, while racking up gains of 11.9% year to date and 122.2% over 5 years.
- Those returns sit against a backdrop of Berkshire steadily compounding book value and selectively putting its massive cash pile to work, from opportunistic buybacks to high profile investments across financials, energy and technology. Together, these moves have reinforced the perception of Berkshire as a defensive compounder, but they have also raised the question of whether investors are now paying a premium for safety.
- On our framework it scores a 4/6 valuation check. This suggests the market may still be underestimating parts of the story. Next we will walk through what different valuation approaches say about that gap, before finishing with a more nuanced way to think about Berkshire’s true worth.
Approach 1: Berkshire Hathaway Excess Returns Analysis
The Excess Returns model looks at how much value a company creates above the return investors reasonably demand on its equity, then capitalizes those surplus profits into an intrinsic value per share.
For Berkshire Hathaway, the starting point is an enormous equity base, with Book Value at about $485,274.36 per share, expected to rise to a Stable Book Value of $514,986.06 per share, based on analyst estimates. On that capital, Berkshire is projected to generate Stable EPS of $66,154.88 per share, implying an Average Return on Equity of 12.85%.
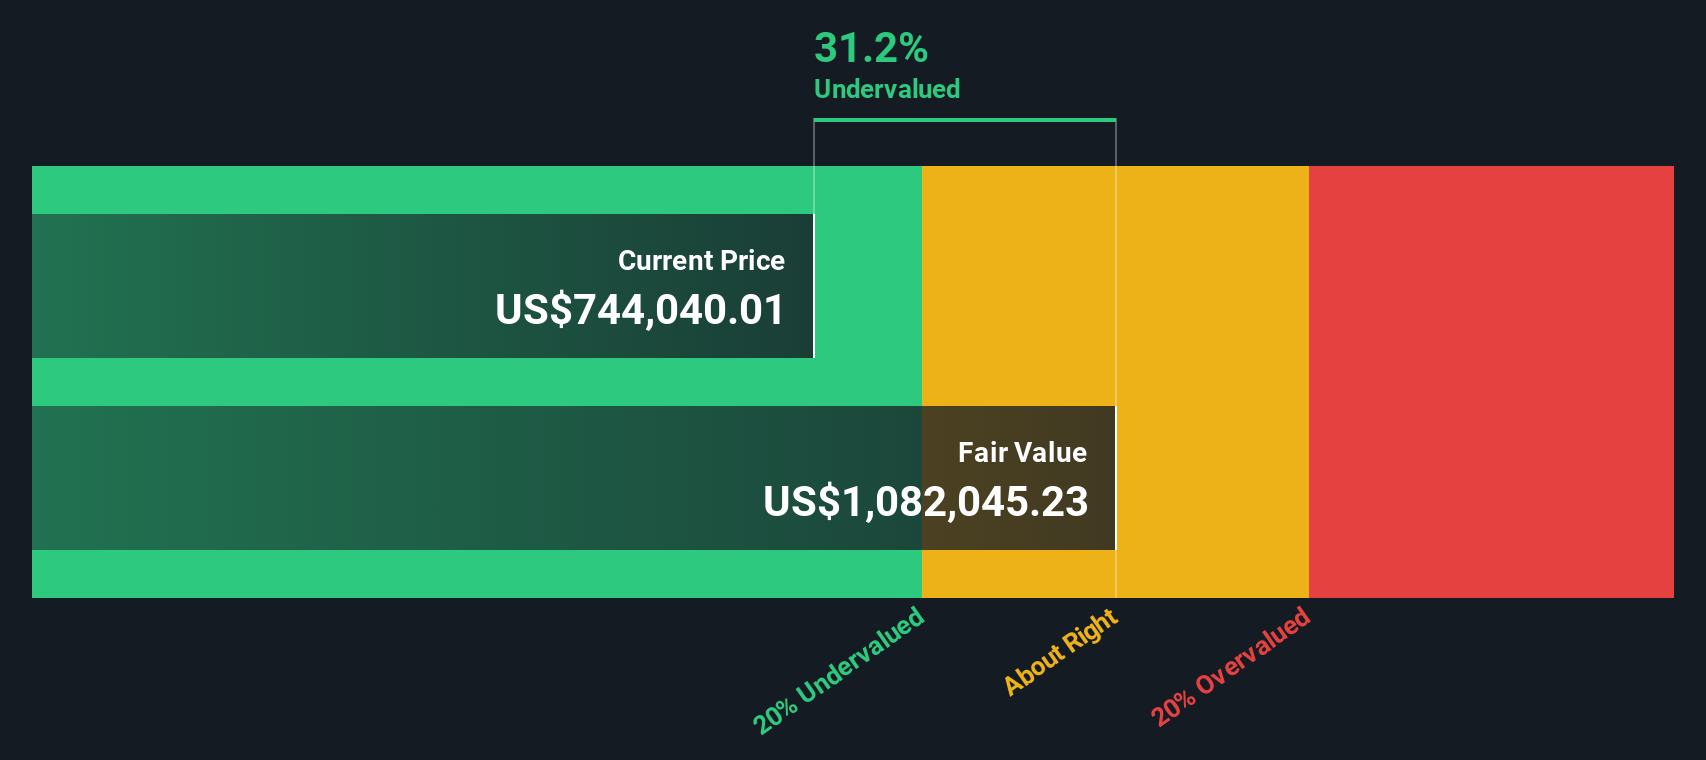
Investors, however, only require a Cost of Equity of roughly $38,879.46 per share, so the model calculates Excess Return of $27,275.42 per share each year. By projecting these excess profits forward and discounting them, the Excess Returns valuation implies Berkshire is trading at a 34.3% discount to its intrinsic value, indicating the shares are priced below the model’s estimate of fair value.
This indicates that the market price is below what the model suggests based on Berkshire’s ability to compound capital at the rates implied by the inputs.
Result: UNDERVALUED
Our Excess Returns analysis suggests Berkshire Hathaway is undervalued by 34.3%. Track this in your watchlist or portfolio, or discover 914 more undervalued stocks based on cash flows.
Approach 2: Berkshire Hathaway Price vs Earnings
For a mature, consistently profitable business like Berkshire Hathaway, the price to earnings, or PE, ratio is a useful lens because it directly links what investors pay today to the cash generating power of the underlying earnings. In general, faster growth and lower perceived risk justify a higher PE, while slower growth or higher uncertainty usually pull a stock’s PE down toward or below the market and sector averages.
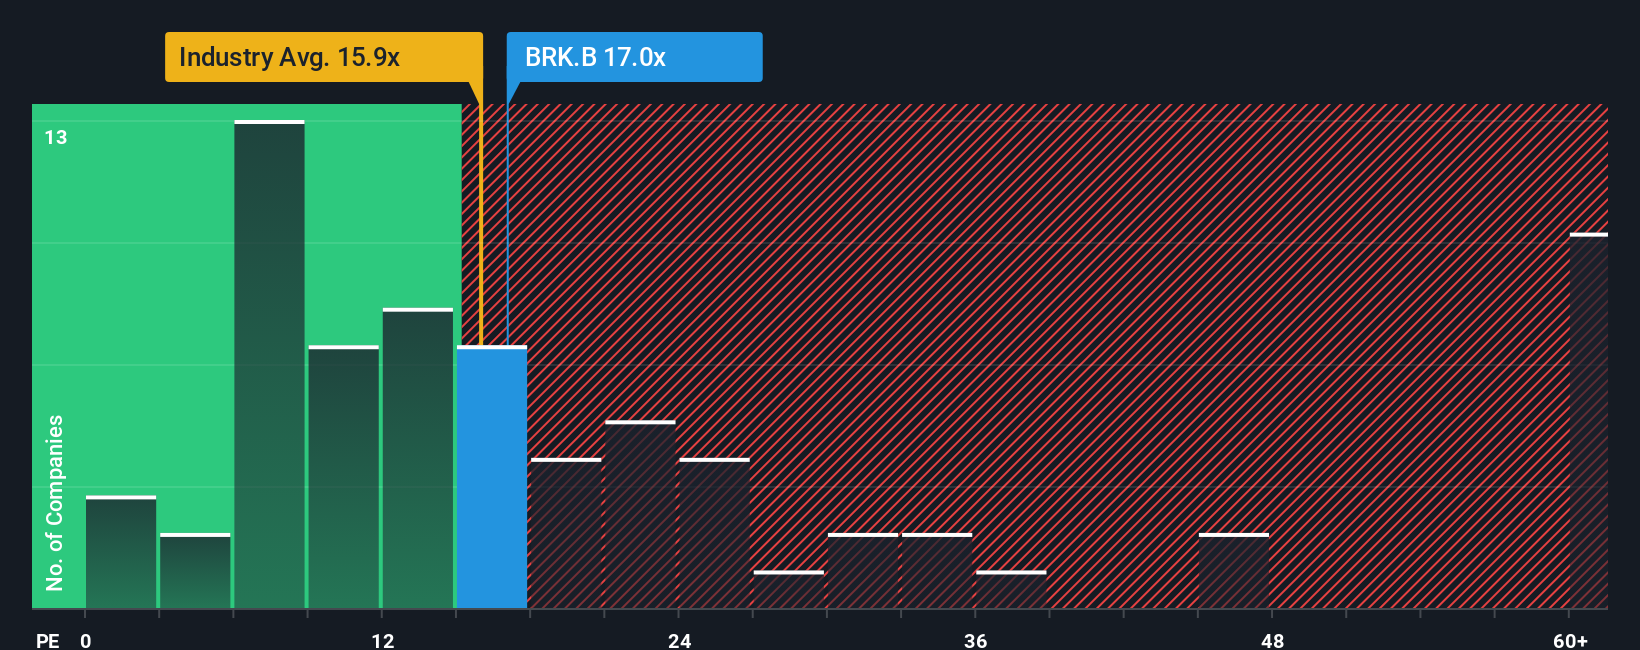
Berkshire currently trades on a PE of about 16.1x, modestly above the Diversified Financial industry average of roughly 13.6x, but well below the broader peer group average of around 26.0x. To refine that comparison, Simply Wall St estimates a Fair Ratio of 16.9x for Berkshire. This is the PE level you might expect once factors such as earnings growth prospects, profitability, risk profile, industry positioning and company size are all taken into account.
This Fair Ratio approach is more tailored than a simple peer or sector comparison because it adjusts for Berkshire’s specific strengths and risks, rather than assuming all financial conglomerates deserve the same multiple. With the current PE at 16.1x versus a Fair Ratio of 16.9x, the shares screen as modestly undervalued on this metric.
Result: UNDERVALUED
PE ratios tell one story, but what if the real opportunity lies elsewhere? Discover 1454 companies where insiders are betting big on explosive growth.
Upgrade Your Decision Making: Choose your Berkshire Hathaway Narrative
Earlier we mentioned that there is an even better way to understand valuation, so let us introduce you to Narratives, a simple way to connect your view of a company with concrete numbers. A Narrative is your story about a business, expressed through assumptions about its future revenue, earnings and margins and the fair value you believe those cash flows support. On Simply Wall St’s Community page, used by millions of investors, Narratives link this story to a full financial forecast and then to a fair value estimate, which you can easily compare with today’s share price to help inform your own decision to buy, hold or sell. Because Narratives update dynamically when new information such as earnings or major news is released, your view of Berkshire can evolve in real time instead of being locked into a static model. For example, one Berkshire Narrative might assume slower premium growth and lower investment returns and arrive at a conservative fair value, while another might project stronger underwriting results and higher reinvestment returns, leading to a much higher estimate of what the shares are really worth.
Do you think there's more to the story for Berkshire Hathaway? Head over to our Community to see what others are saying!
This article by Simply Wall St is general in nature. We provide commentary based on historical data and analyst forecasts only using an unbiased methodology and our articles are not intended to be financial advice. It does not constitute a recommendation to buy or sell any stock, and does not take account of your objectives, or your financial situation. We aim to bring you long-term focused analysis driven by fundamental data. Note that our analysis may not factor in the latest price-sensitive company announcements or qualitative material. Simply Wall St has no position in any stocks mentioned.
Have feedback on this article? Concerned about the content? Get in touch with us directly. Alternatively, email editorial-team@simplywallst.com