
- PREMIUM
- LIVE QUOTES
- INSTITUTIONS
 Index Options
 State Street
 CME Group
 Nasdaq
 Cboe
Cboe TradingView
 Wall Street Journal
Does Innoviva’s Recent Pullback Create a Long Term Opportunity in 2025?
- If you have been wondering whether Innoviva is quietly turning into a value opportunity or just looks cheap on the surface, you are not alone. That is exactly what we are going to unpack here.
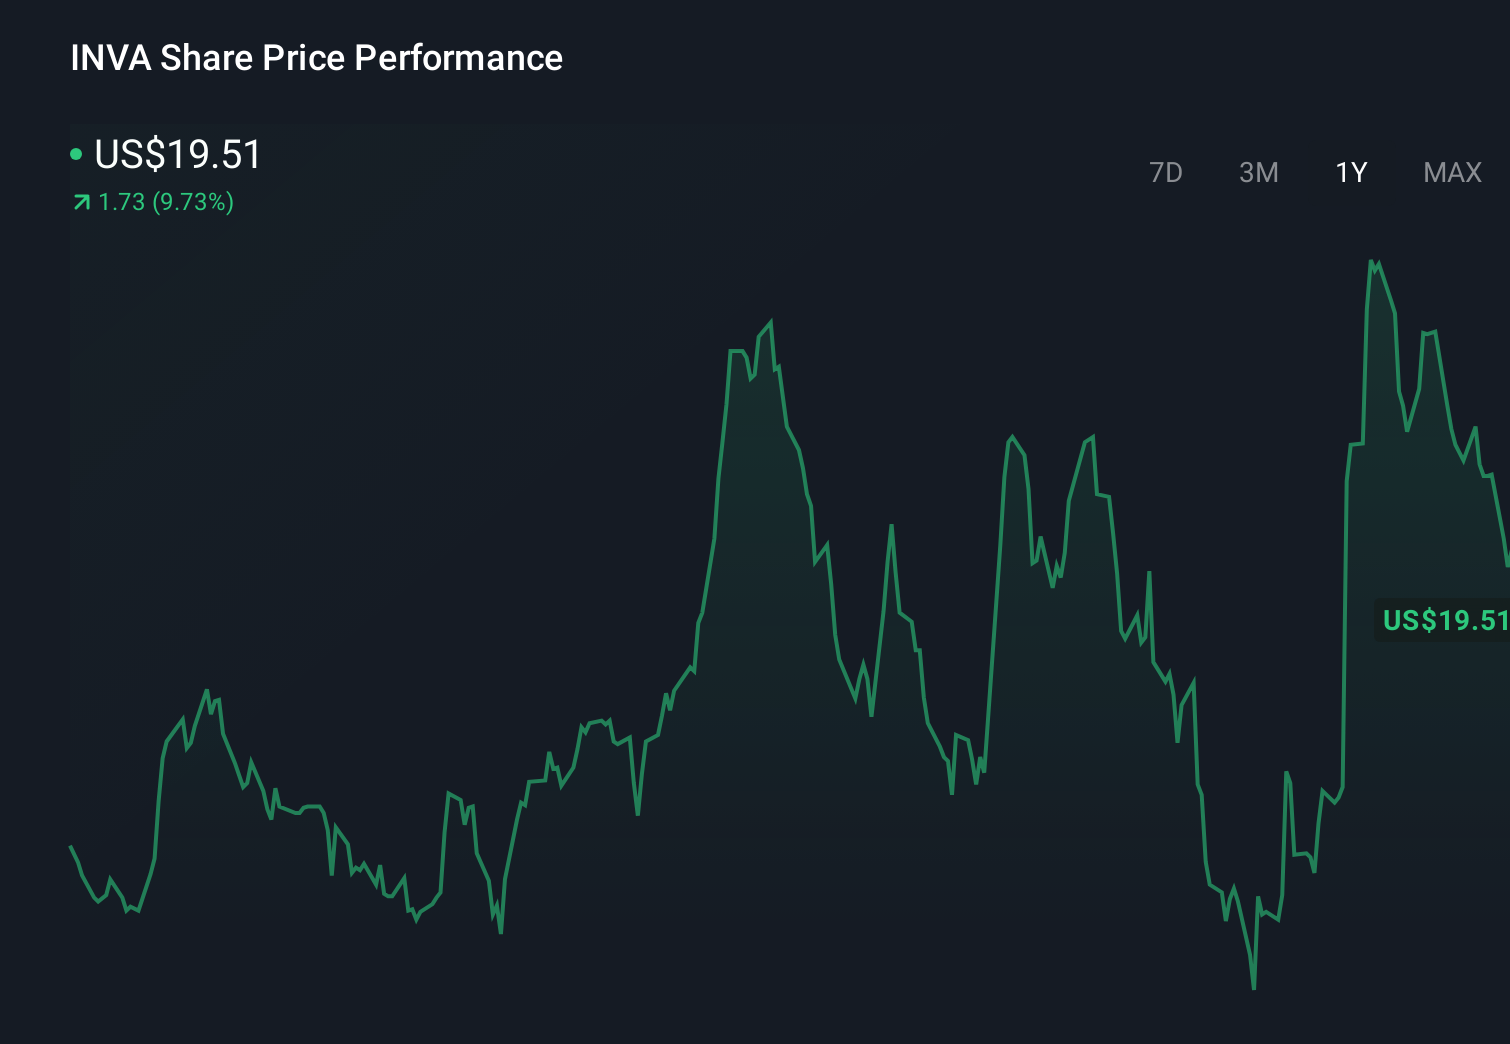
- The stock has pulled back recently, slipping about 2.8% over the last week and 8.3% over the last month, but it is still up 15.2% year to date and roughly 11.8% over the past year, with longer term 3 year and 5 year gains of 48.8% and 62.5% that may hint at a solid underlying story.
- Recent attention on Innoviva has centered on its evolving portfolio in respiratory and infectious disease treatments, plus strategic moves to grow its royalties and equity stakes in partner companies. Together, these developments have reshaped how investors think about its long term cash flows and optionality. At the same time, the market is weighing how this more diversified, asset rich profile fits into a shifting biotech and pharma landscape where balance sheet strength and recurring revenue are being rewarded more consistently.
- On our framework Innoviva scores a 5/6 valuation score, meaning it screens as undervalued on five of six key checks. Next, we will walk through the main valuation approaches behind that number and then finish by looking at a more complete way to judge what the stock is really worth.
Find out why Innoviva's 11.8% return over the last year is lagging behind its peers.
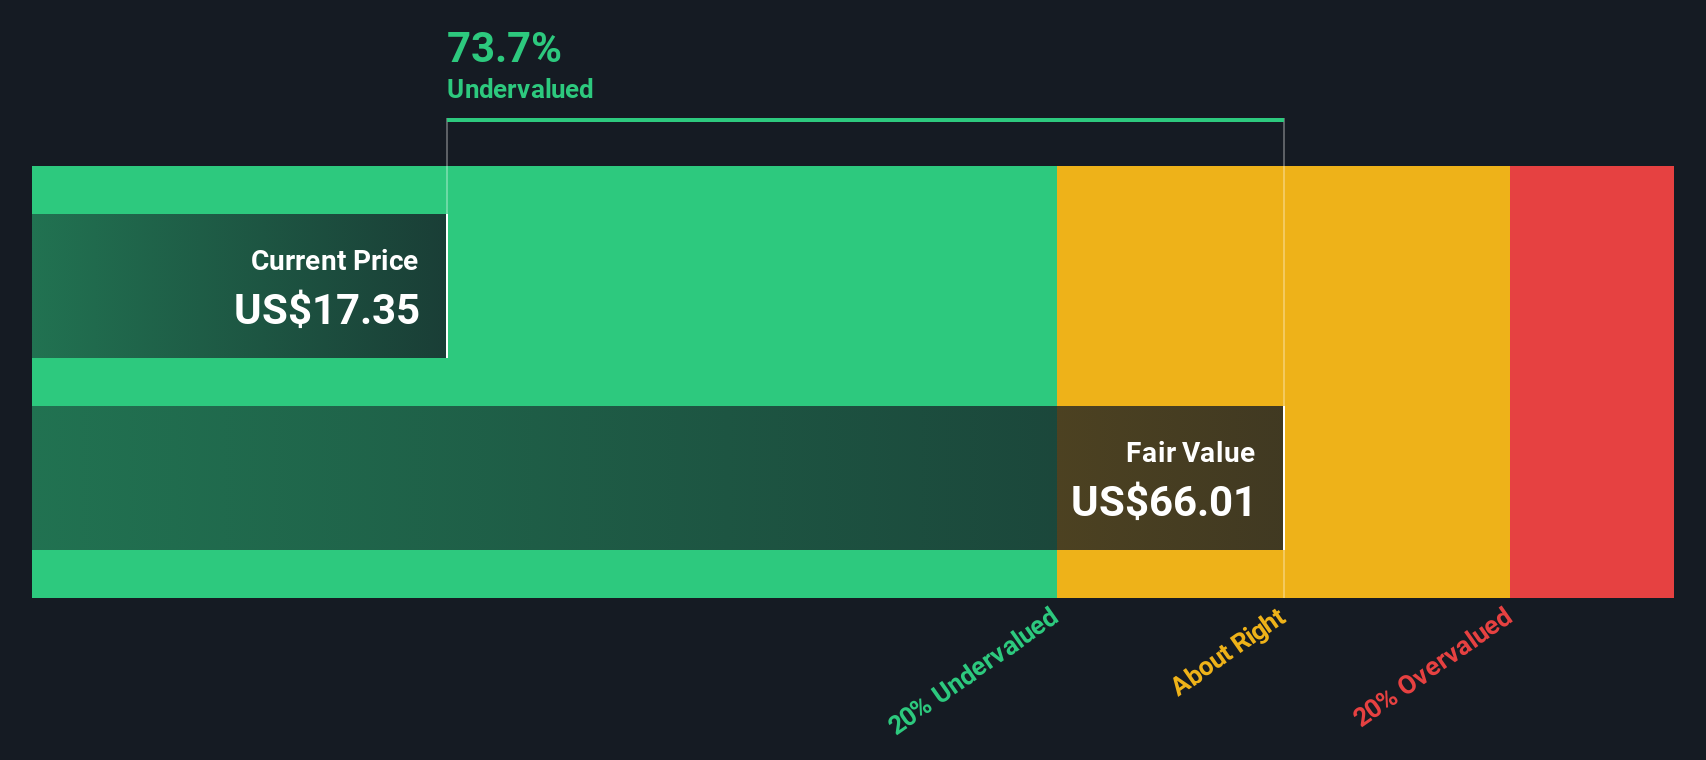
Approach 1: Innoviva Discounted Cash Flow (DCF) Analysis
A Discounted Cash Flow model estimates what a company is worth today by projecting its future cash flows and then discounting those back to a present value using a required rate of return. For Innoviva, the model used is a 2 Stage Free Cash Flow to Equity approach, built on cash flow projections in $.
Innoviva generated about $192.6 million in free cash flow over the last twelve months. Analysts provide detailed forecasts for the next few years and Simply Wall St then extrapolates further, with projected free cash flow of roughly $192.8 million by 2035. These estimates factor in a moderation from near term analyst expectations, followed by modest long term growth.
Adding up all the discounted projected cash flows results in an estimated intrinsic value of $54.61 per share. Compared with the current share price, this implies the stock is trading at a 63.3% discount to its DCF value, which may indicate a substantial margin of safety for long term investors who consider these cash flow assumptions appropriate for their analysis.
Result: UNDERVALUED
Our Discounted Cash Flow (DCF) analysis suggests Innoviva is undervalued by 63.3%. Track this in your watchlist or portfolio, or discover 913 more undervalued stocks based on cash flows.
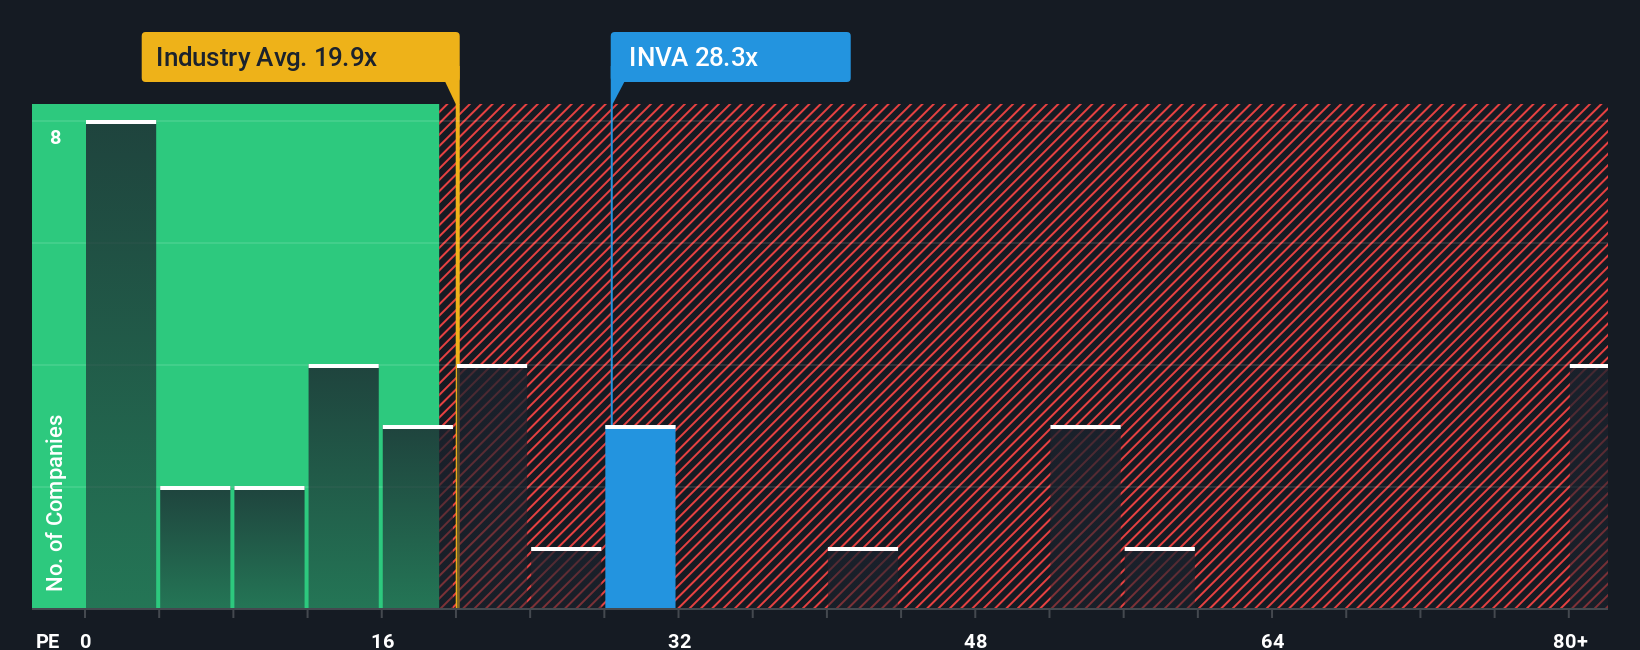
Approach 2: Innoviva Price vs Earnings
For profitable companies like Innoviva, the price to earnings, or PE, ratio is a straightforward way to gauge how much investors are paying for each dollar of current profit. The level of a normal or fair PE usually reflects what the market expects for future earnings growth and how risky those earnings are, with faster growing or lower risk businesses typically commanding higher multiples.
Innoviva currently trades on a PE of about 11.8x. That is well below the broader Pharmaceuticals industry average of roughly 20.2x and also sits at a steep discount to the 26.9x average of close peers, suggesting the market is pricing Innoviva more conservatively than many comparables.
Simply Wall St also calculates a proprietary Fair Ratio of 16.9x for Innoviva, which represents the PE you might reasonably expect given its earnings growth profile, profitability, industry, market cap and key risks. This approach offers a more tailored benchmark than a simple peer or sector comparison, because it adjusts for company specific strengths and weaknesses rather than assuming all firms deserve the same multiple. With Innoviva trading at 11.8x versus a Fair Ratio of 16.9x, the multiple based view supports the idea that the shares are undervalued.
Result: UNDERVALUED
PE ratios tell one story, but what if the real opportunity lies elsewhere? Discover 1454 companies where insiders are betting big on explosive growth.
Upgrade Your Decision Making: Choose your Innoviva Narrative
Earlier we mentioned that there is an even better way to understand valuation, so let us introduce you to Narratives, a simple framework that lets you connect your view of Innoviva’s business to clear numbers like future revenue, earnings, margins and, ultimately, a fair value estimate. A Narrative is essentially your story about the company, translated into a financial forecast and then into a fair value that you can directly compare with today’s share price to decide whether Innoviva looks like a buy, a hold, or a sell. Narratives on Simply Wall St, available to millions of investors through the Community page, make this process accessible by guiding you through key assumptions and instantly showing the impact on fair value. They also update dynamically as new information such as earnings releases or major news arrives, so your view stays current without needing to rebuild a model from scratch. For example, one Innoviva Narrative on the Community page may assume strong respiratory portfolio growth and assign a high fair value, while another more cautious Narrative might focus on slower royalty expansion and a tighter profit margin, resulting in a much lower fair value.
Do you think there's more to the story for Innoviva? Head over to our Community to see what others are saying!
This article by Simply Wall St is general in nature. We provide commentary based on historical data and analyst forecasts only using an unbiased methodology and our articles are not intended to be financial advice. It does not constitute a recommendation to buy or sell any stock, and does not take account of your objectives, or your financial situation. We aim to bring you long-term focused analysis driven by fundamental data. Note that our analysis may not factor in the latest price-sensitive company announcements or qualitative material. Simply Wall St has no position in any stocks mentioned.
Have feedback on this article? Concerned about the content? Get in touch with us directly. Alternatively, email editorial-team@simplywallst.com