
- PREMIUM
- LIVE QUOTES
- INSTITUTIONS
 Index Options
 State Street
 CME Group
 Nasdaq
 Cboe
Cboe TradingView
 Wall Street Journal
Is Porsche Stock Still Attractive After a 20.6% Slide Amid Premium Valuation Concerns?
- Wondering if Dr. Ing. h.c. F. Porsche is a bargain hiding in plain sight, or a value trap in the making? Here is a breakdown of where the market might be mispricing this iconic sports car brand.
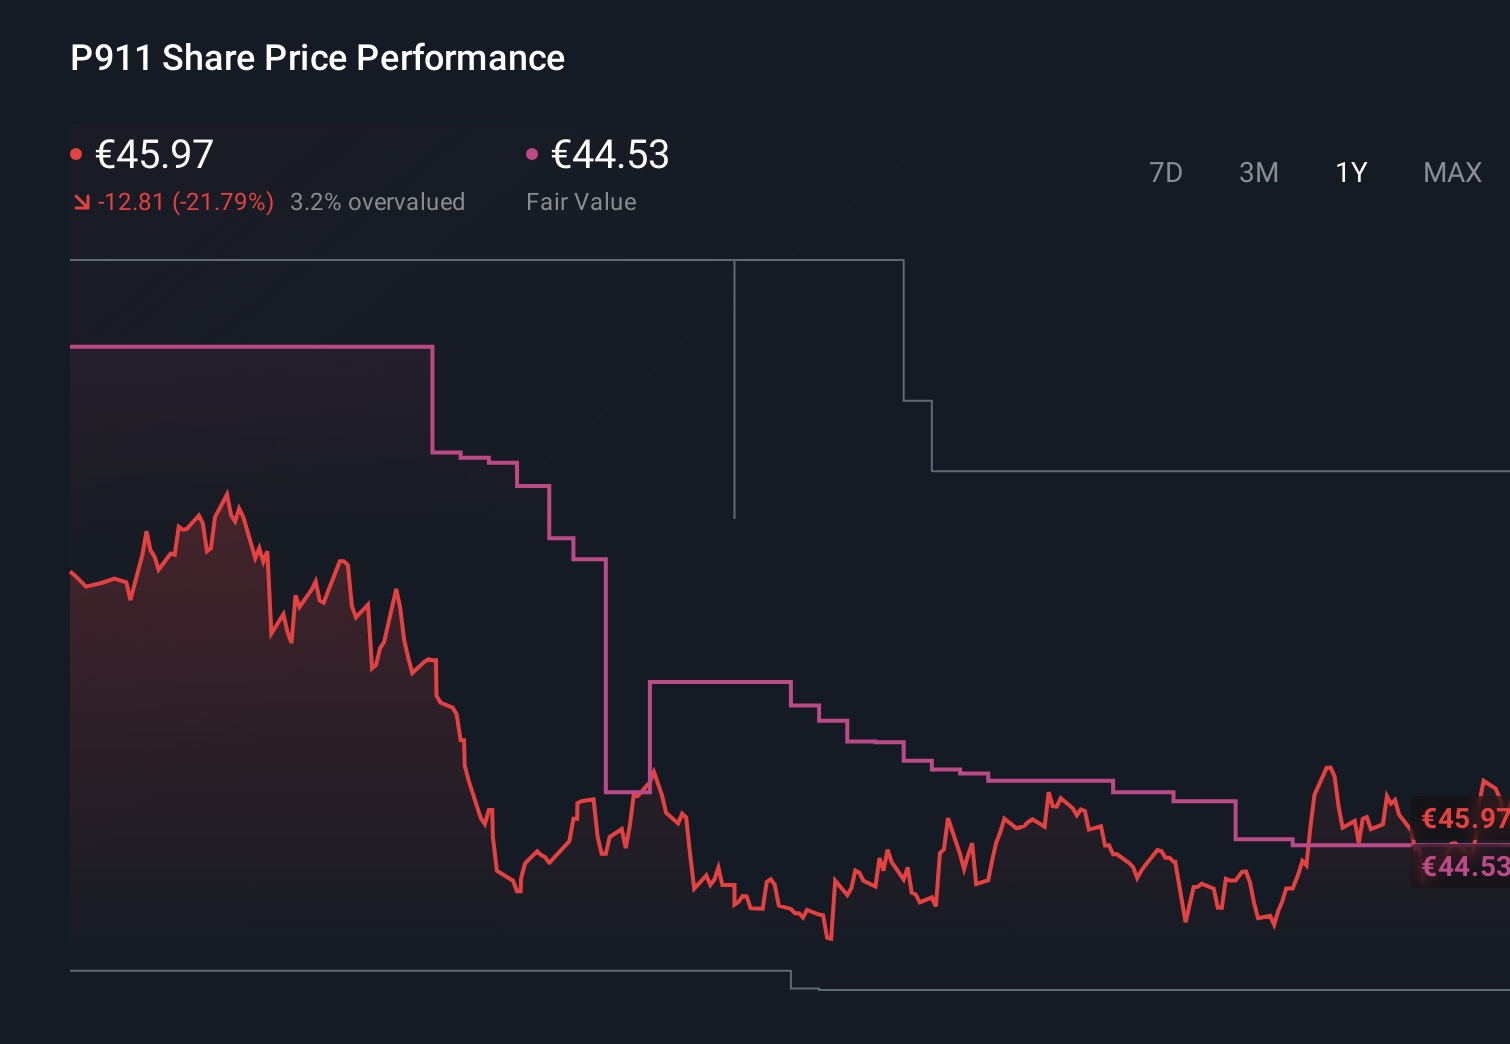
- The stock has slipped 0.1% over the last week, bounced about 4.3% in the last month, but is still down 20.6% year to date and 17.2% over the past year, reflecting a cautious shift in sentiment after a tough multi year slide of 44.8%.
- Recent headlines have focused on the broader auto sector's transition toward electrification and software driven features, with investors reassessing how legacy performance brands fit into that future. At the same time, discussion around luxury demand resilience and premium pricing power has kept Porsche in the spotlight as markets weigh cyclical risks against long term brand strength.
- On our valuation framework, Dr. Ing. h.c. F. Porsche only scores 1/6 for being undervalued across key checks, which might sound underwhelming at first glance. In the next sections, we will unpack what different valuation approaches say about the stock, and then finish with a more holistic way to think about Porsche's true long term value.
Dr. Ing. h.c. F. Porsche scores just 1/6 on our valuation checks. See what other red flags we found in the full valuation breakdown.
Approach 1: Dr. Ing. h.c. F. Porsche Discounted Cash Flow (DCF) Analysis
A Discounted Cash Flow model estimates what a business is worth by projecting its future cash flows and then discounting them back to today to reflect risk and the time value of money. For Dr. Ing. h.c. F. Porsche, the model used is a two stage Free Cash Flow to Equity approach, based on cash flows in €.
The company generated around €1.16 billion in free cash flow over the last twelve months and analysts expect this to grow meaningfully, with projections rising to roughly €2.94 billion by 2029. Beyond the first few analyst covered years, Simply Wall St extrapolates cash flows out to 10 years using gradually slowing growth assumptions to reflect a more mature phase.
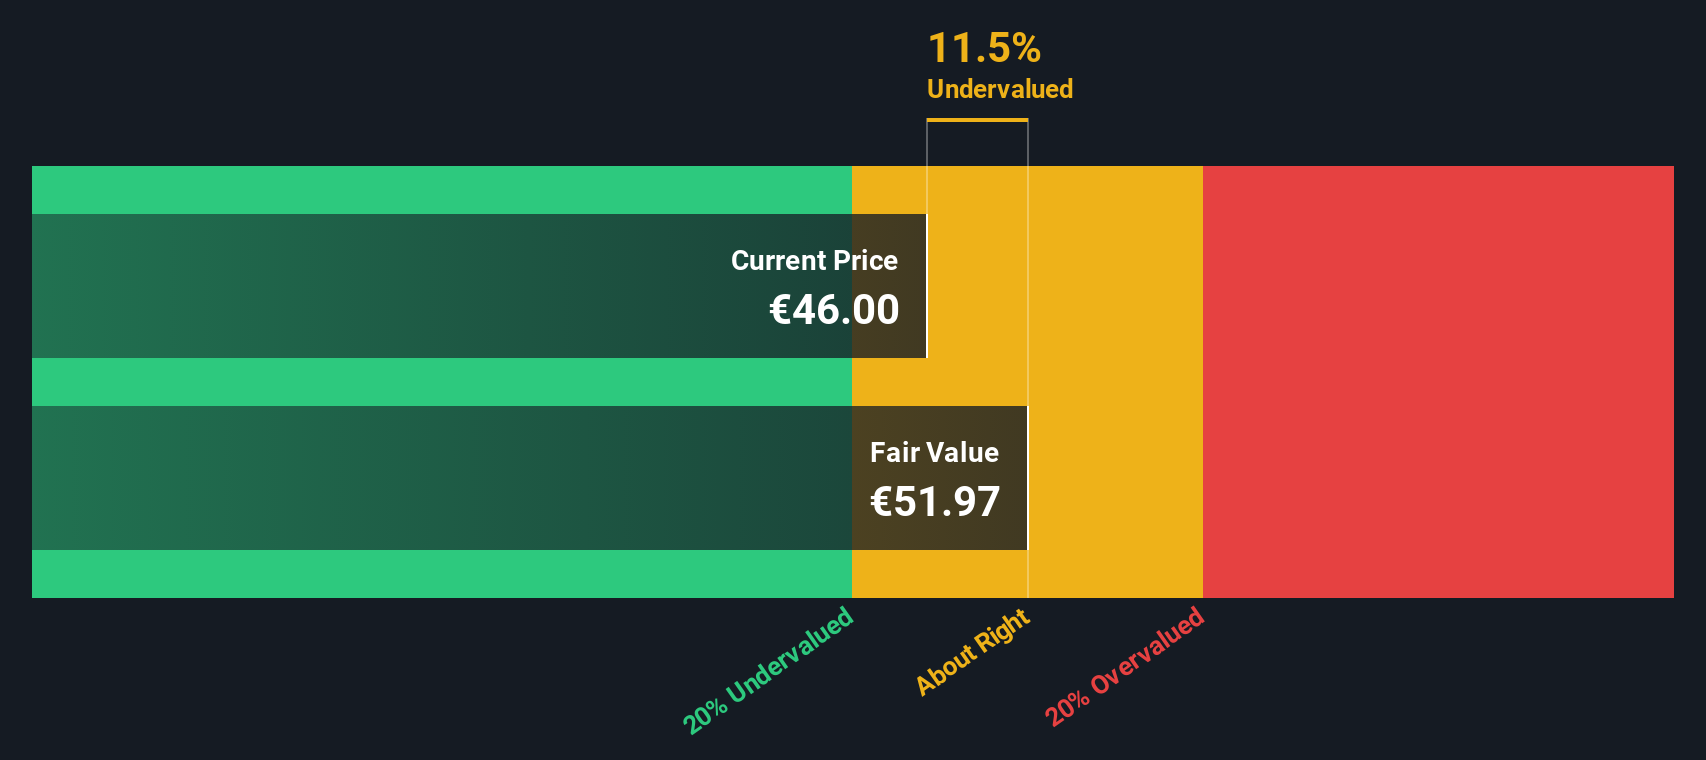
When these cash flows are discounted back, the model arrives at an intrinsic value of about €47.21 per share, implying the stock trades at roughly a 2.0% discount to fair value. That is a very small margin of safety, suggesting the DCF view is that the market is broadly pricing Porsche correctly.
Result: ABOUT RIGHT
Dr. Ing. h.c. F. Porsche is fairly valued according to our Discounted Cash Flow (DCF), but this can change at a moment's notice. Track the value in your watchlist or portfolio and be alerted on when to act.
Approach 2: Dr. Ing. h.c. F. Porsche Price vs Earnings
For a profitable business like Dr. Ing. h.c. F. Porsche, the price to earnings (PE) ratio is a useful way to gauge how much investors are willing to pay for each euro of earnings. In general, faster growing and less risky companies deserve a higher PE, while slower growth or higher uncertainty should be reflected in a lower multiple.
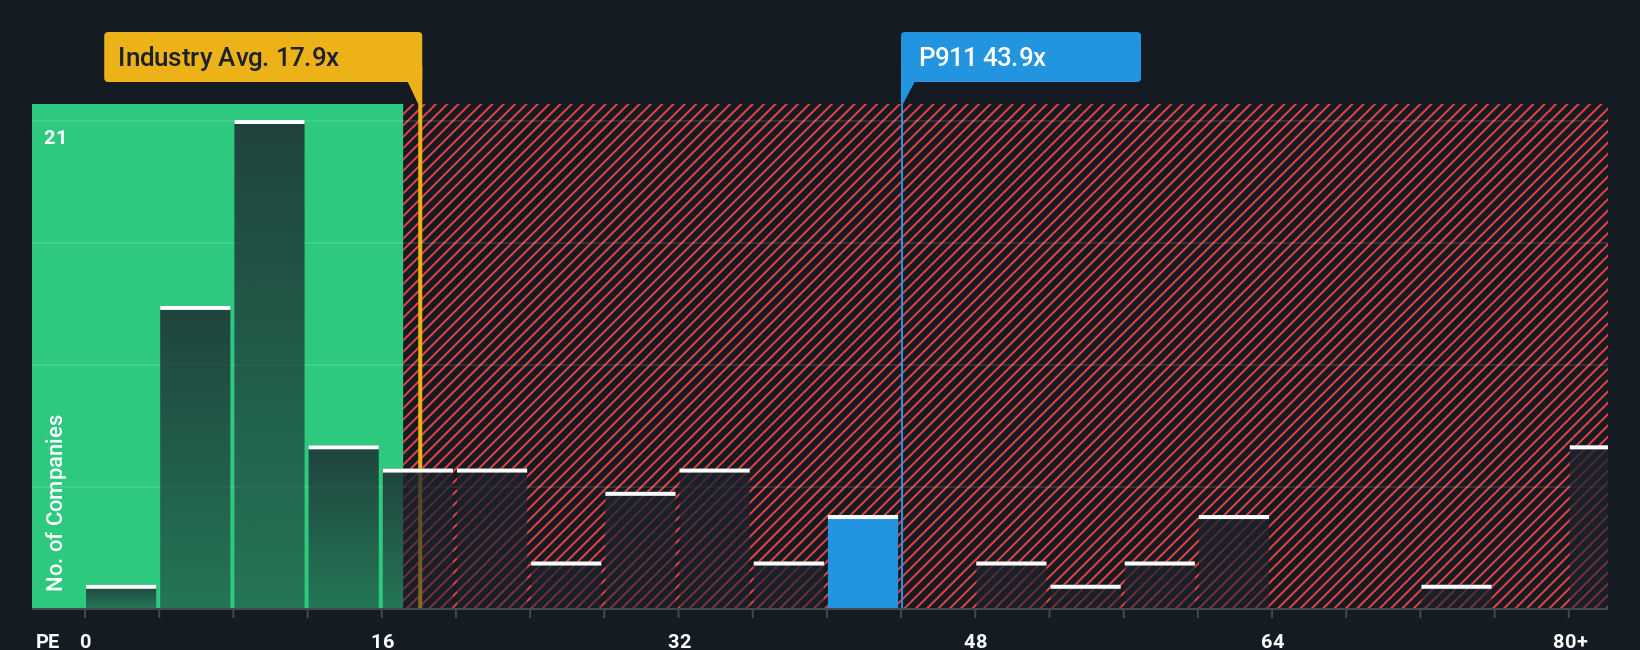
Porsche currently trades on about 44.26x earnings, which is more than double the Auto sector average of roughly 18.74x and also well above the broader peer group at around 20.35x. That gap suggests the market is pricing in a premium for the brand, earnings quality or expectations about future growth.
Simply Wall St’s Fair Ratio framework goes a step further by estimating what PE multiple would be justified after accounting for Porsche’s specific earnings growth outlook, profitability, risk profile, industry positioning and market cap. On this basis, Porsche’s Fair Ratio is around 18.40x, much closer to where the industry trades. Because the actual PE of 44.26x sits far above this Fair Ratio, the multiple based view points to the shares looking expensive rather than mispriced in your favor.
Result: OVERVALUED
PE ratios tell one story, but what if the real opportunity lies elsewhere? Discover 1454 companies where insiders are betting big on explosive growth.
Upgrade Your Decision Making: Choose your Dr. Ing. h.c. F. Porsche Narrative
Earlier we mentioned that there is an even better way to understand valuation, so let us introduce you to Narratives, a simple way to connect your view of a company’s future with concrete numbers and a fair value estimate.
A Narrative is the story behind your assumptions, where you spell out how you think Porsche’s revenue, earnings and margins will evolve, and the platform turns that story into a transparent forecast and resulting fair value.
On Simply Wall St, Narratives live in the Community page and are used by millions of investors, helping you see how different views on things like EV adoption, China exposure or cost cutting translate into different future cash flows and valuation ranges.
Because each Narrative continuously compares its Fair Value to today’s Price and updates dynamically when new earnings, news or guidance arrive, it becomes a living decision tool that can signal when your buy or sell thesis may be playing out, whether you lean toward a more optimistic Porsche path, closer to €64 per share, or a cautious one, nearer €37.
Do you think there's more to the story for Dr. Ing. h.c. F. Porsche? Head over to our Community to see what others are saying!
This article by Simply Wall St is general in nature. We provide commentary based on historical data and analyst forecasts only using an unbiased methodology and our articles are not intended to be financial advice. It does not constitute a recommendation to buy or sell any stock, and does not take account of your objectives, or your financial situation. We aim to bring you long-term focused analysis driven by fundamental data. Note that our analysis may not factor in the latest price-sensitive company announcements or qualitative material. Simply Wall St has no position in any stocks mentioned.
Have feedback on this article? Concerned about the content? Get in touch with us directly. Alternatively, email editorial-team@simplywallst.com