
- PREMIUM
- LIVE QUOTES
- INSTITUTIONS
 Index Options
 State Street
 CME Group
 Nasdaq
 Cboe
Cboe TradingView
 Wall Street Journal
Has National Bank of Canada’s 2025 Rally Run Too Far?
- If you are wondering whether National Bank of Canada is still a buy after its big run, you are not alone. This is exactly the stock many value focused investors have on their watchlist right now.
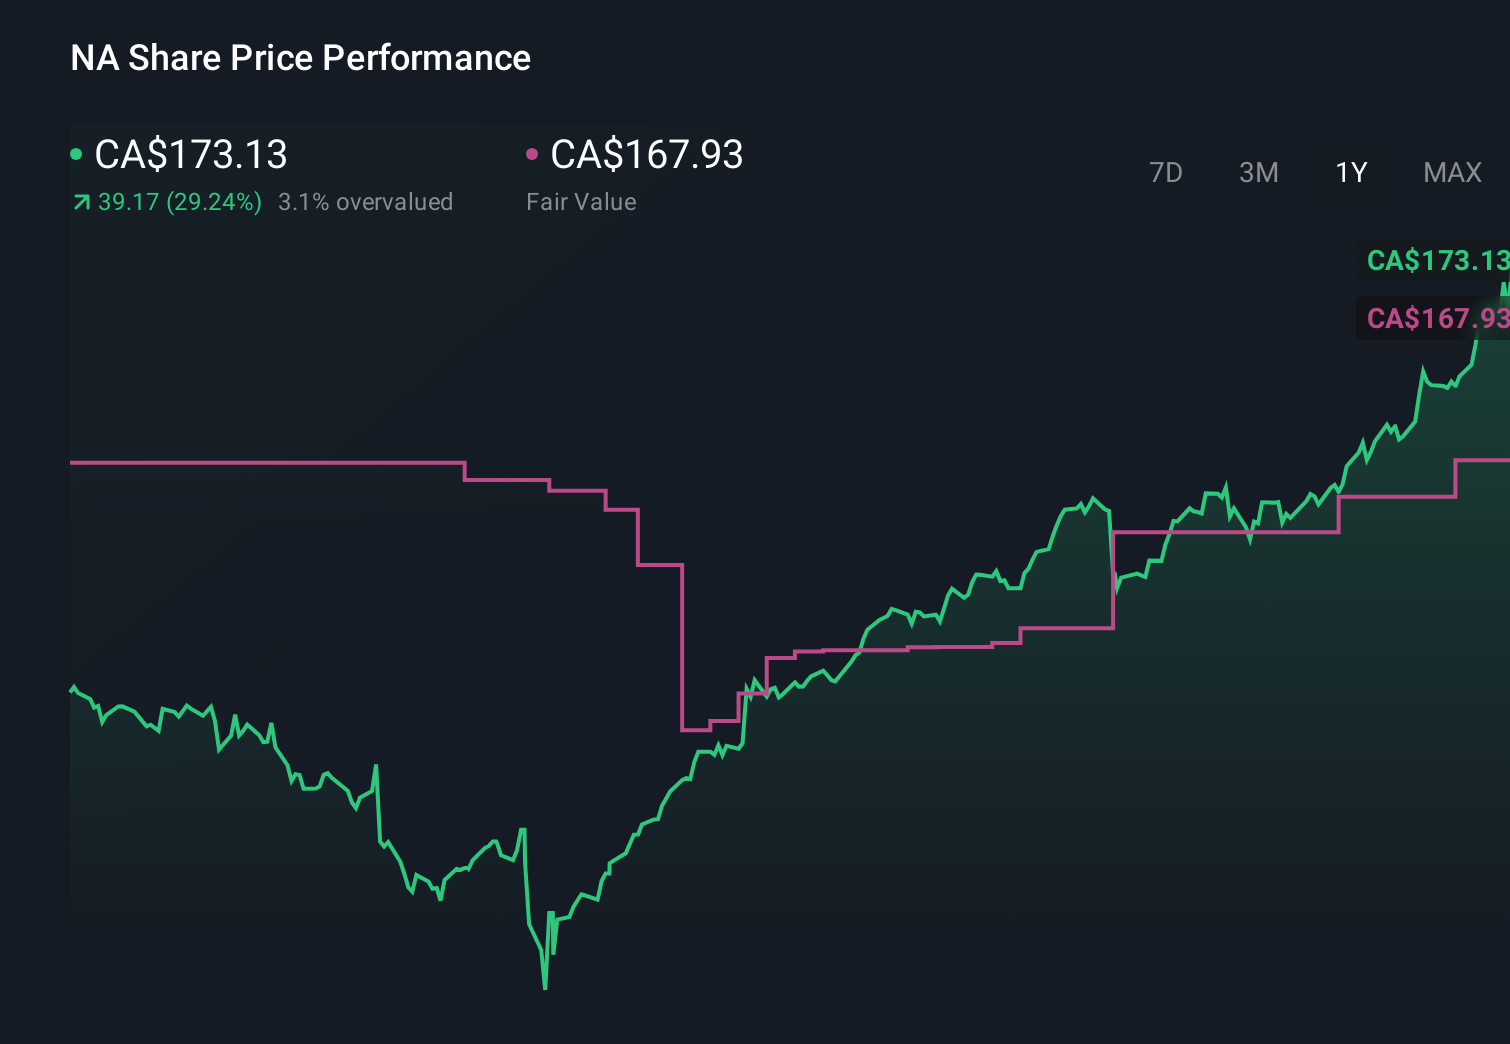
- The share price has climbed 32.1% year to date and 34.4% over the last year, on top of multiyear gains of 108.2% over 3 years and 187.4% over 5 years, even after a modest 0.5% pullback in the last week and a 6.6% rise over the past month.
- Recent headlines have focused on National Bank of Canada solidifying its position among Canada’s major banks, with ongoing attention on its capital strength, credit quality and strategic focus in key domestic markets. There has also been broader sector discussion about how higher for longer interest rate expectations and evolving regulatory conditions could reshape profitability and risk, which helps explain some of the stock price momentum.
- Despite that backdrop, the bank currently scores just 2/6 on our valuation checks, suggesting pockets of undervaluation but also areas where the market might be ahead of fundamentals. In the rest of this article we will walk through multiple ways to value National Bank of Canada, then finish by looking at a more complete, narrative driven approach to deciding what the stock is really worth.
National Bank of Canada scores just 2/6 on our valuation checks. See what other red flags we found in the full valuation breakdown.
Approach 1: National Bank of Canada Excess Returns Analysis
The Excess Returns model looks at how efficiently National Bank of Canada turns shareholder equity into profits above its cost of capital, then projects how long those excess returns can persist.
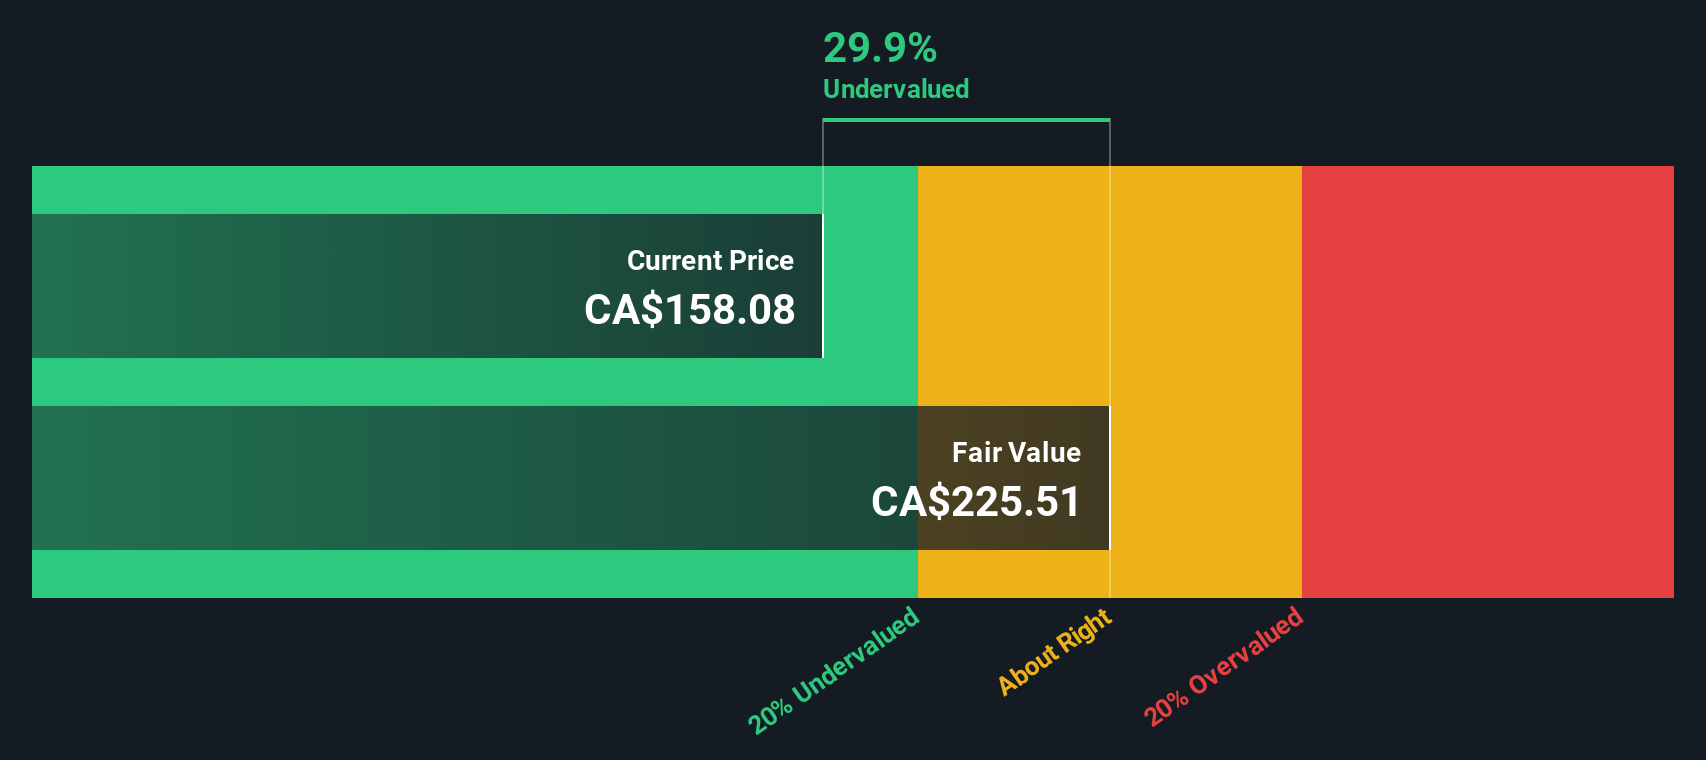
On this view, the bank is starting from a solid base, with Book Value of CA$82.22 per share and a Stable EPS of CA$13.36 per share, based on weighted future Return on Equity estimates from 11 analysts. The Average Return on Equity of 15.11% comfortably exceeds the implied Cost of Equity of CA$6.41 per share, generating an Excess Return of CA$6.96 per share. Analysts also expect Stable Book Value to rise to CA$88.44 per share, supported by forecasts from 9 analysts.
Using these inputs within the Excess Returns framework gives an intrinsic value estimate of about CA$243.20 per share. This implies the stock is roughly 29.1% undervalued compared with the current market price. In simple terms, the model indicates investors are not fully paying for the bank’s ability to reinvest capital at attractive rates.
Result: UNDERVALUED
Our Excess Returns analysis suggests National Bank of Canada is undervalued by 29.1%. Track this in your watchlist or portfolio, or discover 914 more undervalued stocks based on cash flows.
Approach 2: National Bank of Canada Price vs Earnings
For profitable, established banks, the Price to Earnings, or PE, ratio is a useful way to judge whether investors are paying a reasonable price for each dollar of current earnings. What counts as a normal PE depends on how quickly profits are expected to grow and how risky those earnings are, with faster growth and lower perceived risk usually justifying a higher multiple.
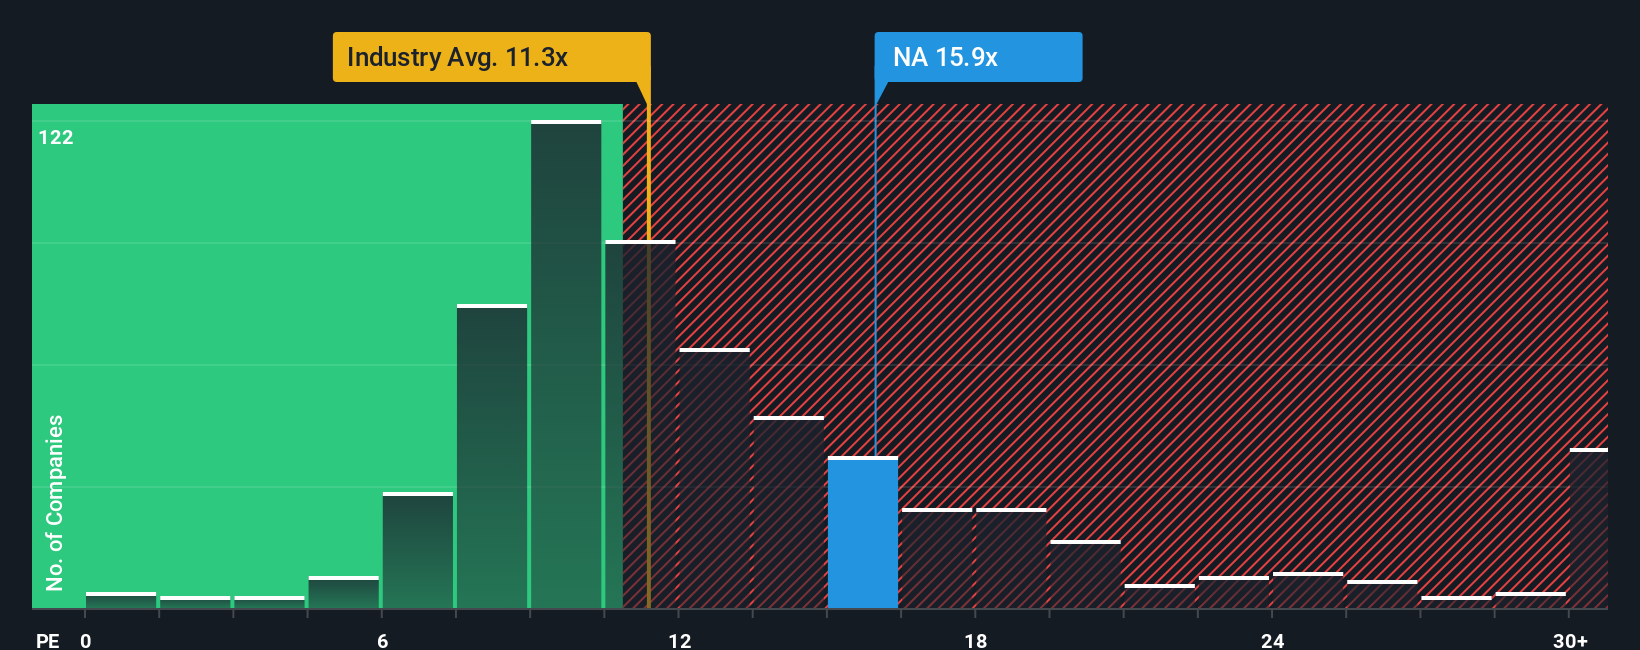
National Bank of Canada currently trades on about 17.46x earnings, which is above both the broader banks industry average of around 10.84x and the peer group average of roughly 14.29x. To refine that comparison, Simply Wall St calculates a Fair Ratio of 13.92x, which is the PE you might expect given the bank’s growth outlook, profitability, size and risk profile.
This Fair Ratio is more informative than simple peer or industry comparisons because it adjusts for company specific drivers like earnings growth, profit margins, risk factors, industry dynamics and market capitalization. Set against that 13.92x Fair Ratio, the current 17.46x PE suggests the market is paying a premium to the level implied by fundamentals.
Result: OVERVALUED
PE ratios tell one story, but what if the real opportunity lies elsewhere? Discover 1454 companies where insiders are betting big on explosive growth.
Upgrade Your Decision Making: Choose your National Bank of Canada Narrative
Earlier we mentioned that there is an even better way to understand valuation, so let us introduce you to Narratives, a simple way to connect your view of a company’s future with a concrete forecast and fair value estimate.
A Narrative is the story behind your numbers, where you spell out how you think a business like National Bank of Canada will grow its revenue, earnings and margins, then link those assumptions to a financial model that produces your own fair value.
On Simply Wall St’s Community page, used by millions of investors, Narratives make this process accessible by guiding you to set expectations, compare your fair value to the current share price, and decide whether the stock looks like a buy, hold or sell based on your outlook.
Because Narratives update dynamically as new earnings, news and analyst estimates come in, they help you keep your thesis current. One investor might build a more optimistic National Bank of Canada Narrative that supports a fair value near CA$168, while another more cautious investor could land closer to CA$113. Each is using the same tool but with different assumptions to decide if today’s price still makes sense.
Do you think there's more to the story for National Bank of Canada? Head over to our Community to see what others are saying!
This article by Simply Wall St is general in nature. We provide commentary based on historical data and analyst forecasts only using an unbiased methodology and our articles are not intended to be financial advice. It does not constitute a recommendation to buy or sell any stock, and does not take account of your objectives, or your financial situation. We aim to bring you long-term focused analysis driven by fundamental data. Note that our analysis may not factor in the latest price-sensitive company announcements or qualitative material. Simply Wall St has no position in any stocks mentioned.
Have feedback on this article? Concerned about the content? Get in touch with us directly. Alternatively, email editorial-team@simplywallst.com