
- PREMIUM
- LIVE QUOTES
- INSTITUTIONS
 Index Options
 State Street
 CME Group
 Nasdaq
 Cboe
Cboe TradingView
 Wall Street Journal
Does PayPal’s Slump From Five Year Highs Signal a Long Term Opportunity in 2025?
- If you are wondering whether PayPal Holdings is a bargain or a value trap at today’s price, you are not alone. That is exactly what we are going to unpack.
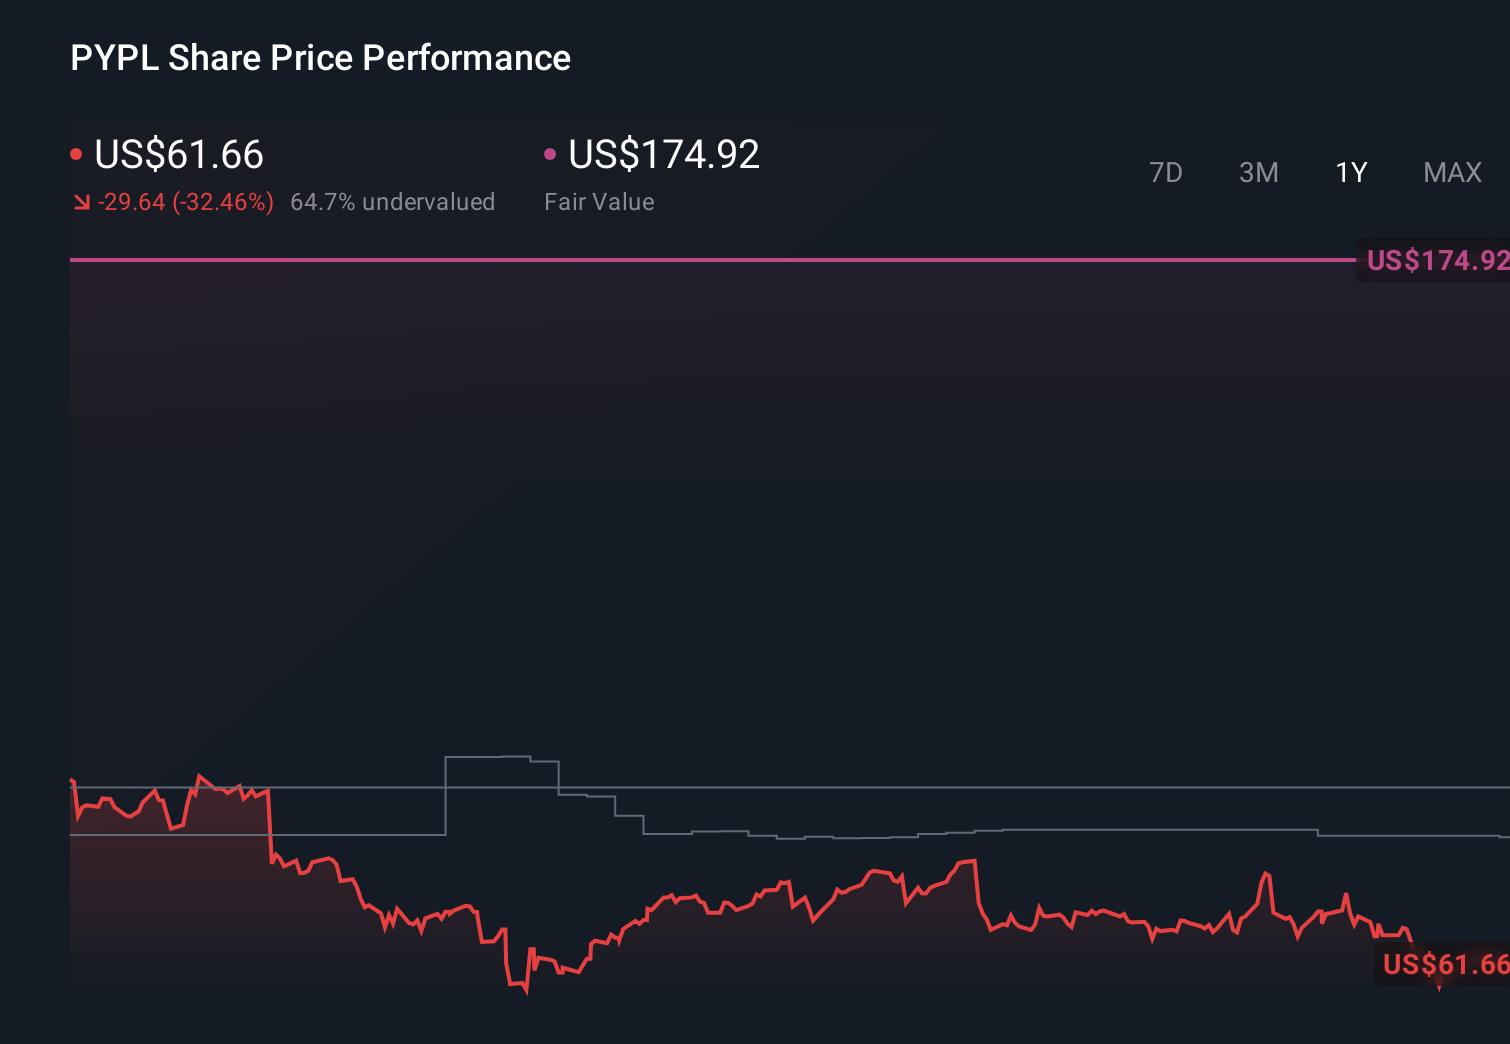
- The stock is trading around $60.18, down 2.4% over the last week and about flat over the past month, but still sitting roughly 30% lower year to date and more than 70% below its 5 year level.
- Recent attention around PayPal has focused on its push to reinvigorate growth through new payment tools and partnerships, alongside ongoing efforts to streamline costs and sharpen its core digital wallet offering. These shifts are reshaping how investors think about both its long term growth runway and the risks attached to its business model.
- On our valuation checks, PayPal scores a solid 5 out of 6, suggesting the market might be underestimating its value. Next we will compare what different valuation approaches indicate, before looking at an even better way to make sense of that fair value story.
Find out why PayPal Holdings's -30.5% return over the last year is lagging behind its peers.
Approach 1: PayPal Holdings Excess Returns Analysis
The Excess Returns model looks at how much profit a company can generate above the minimum return investors demand on its equity, and then projects how long it can keep doing that before competition erodes those gains.
For PayPal, the starting point is a Book Value of $21.46 per share and a Stable EPS of $6.26 per share, based on weighted future Return on Equity estimates from 10 analysts. With a Cost of Equity of $1.97 per share, PayPal is expected to generate an Excess Return of $4.29 per share, supported by a strong Average Return on Equity of 24.62% and a Stable Book Value of $25.42 per share, sourced from 8 analysts.
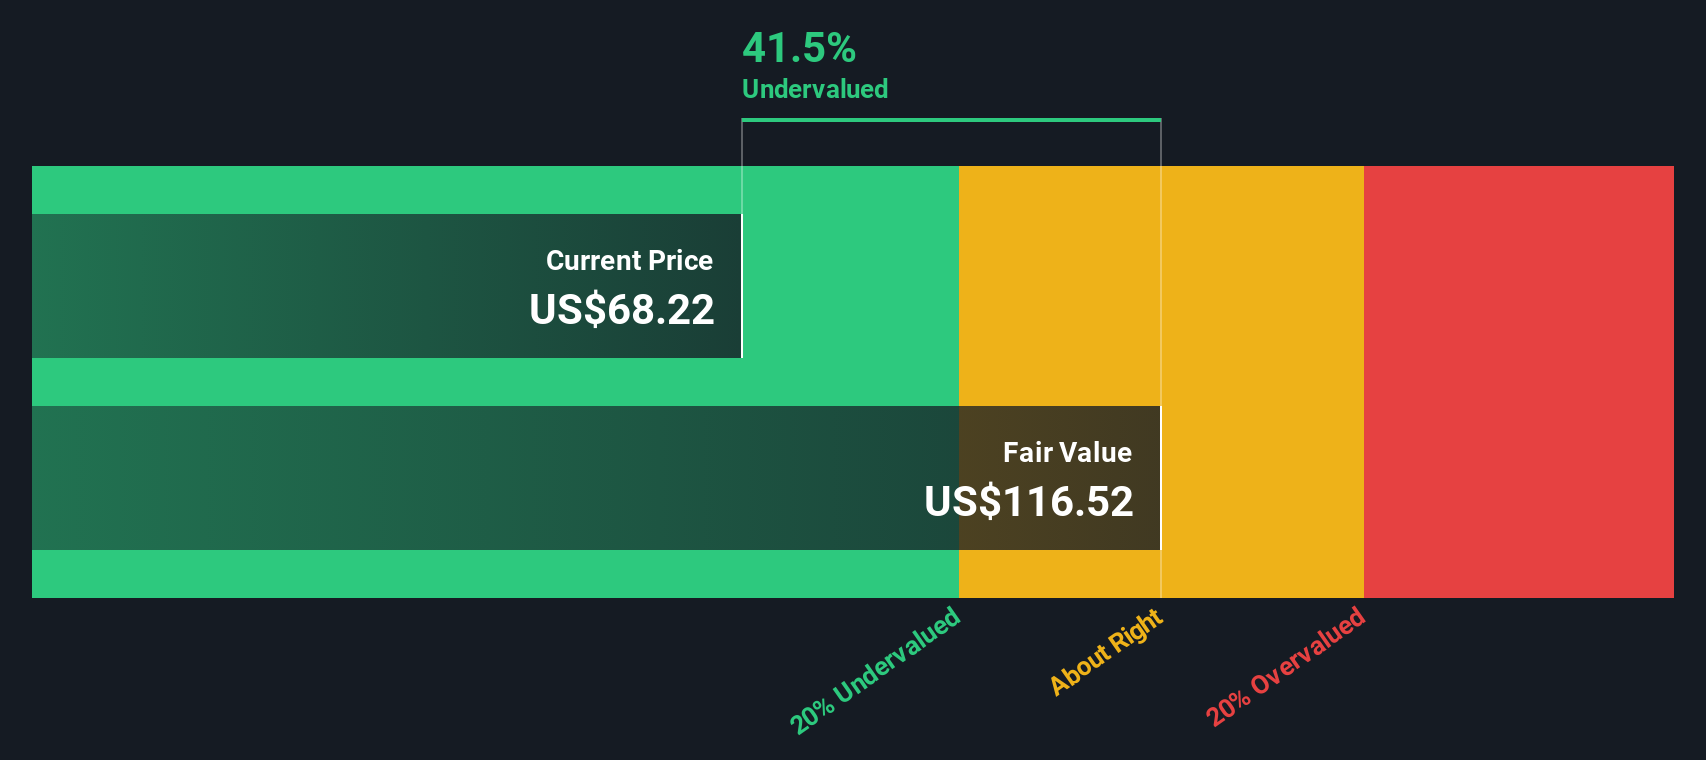
Feeding these inputs into the Excess Returns framework gives an estimated intrinsic value of about $121 per share. Compared with the current share price around $60, the model implies the stock is roughly 50.3% undervalued. This suggests investors are heavily discounting PayPal’s ability to sustain attractive returns on capital.
Result: UNDERVALUED
Our Excess Returns analysis suggests PayPal Holdings is undervalued by 50.3%. Track this in your watchlist or portfolio, or discover 908 more undervalued stocks based on cash flows.
Approach 2: PayPal Holdings Price vs Earnings
For a profitable, established business like PayPal, the price to earnings, or PE, ratio is a useful shorthand for how much investors are willing to pay for each dollar of earnings. It naturally captures both current profitability and how the market is weighing future prospects.
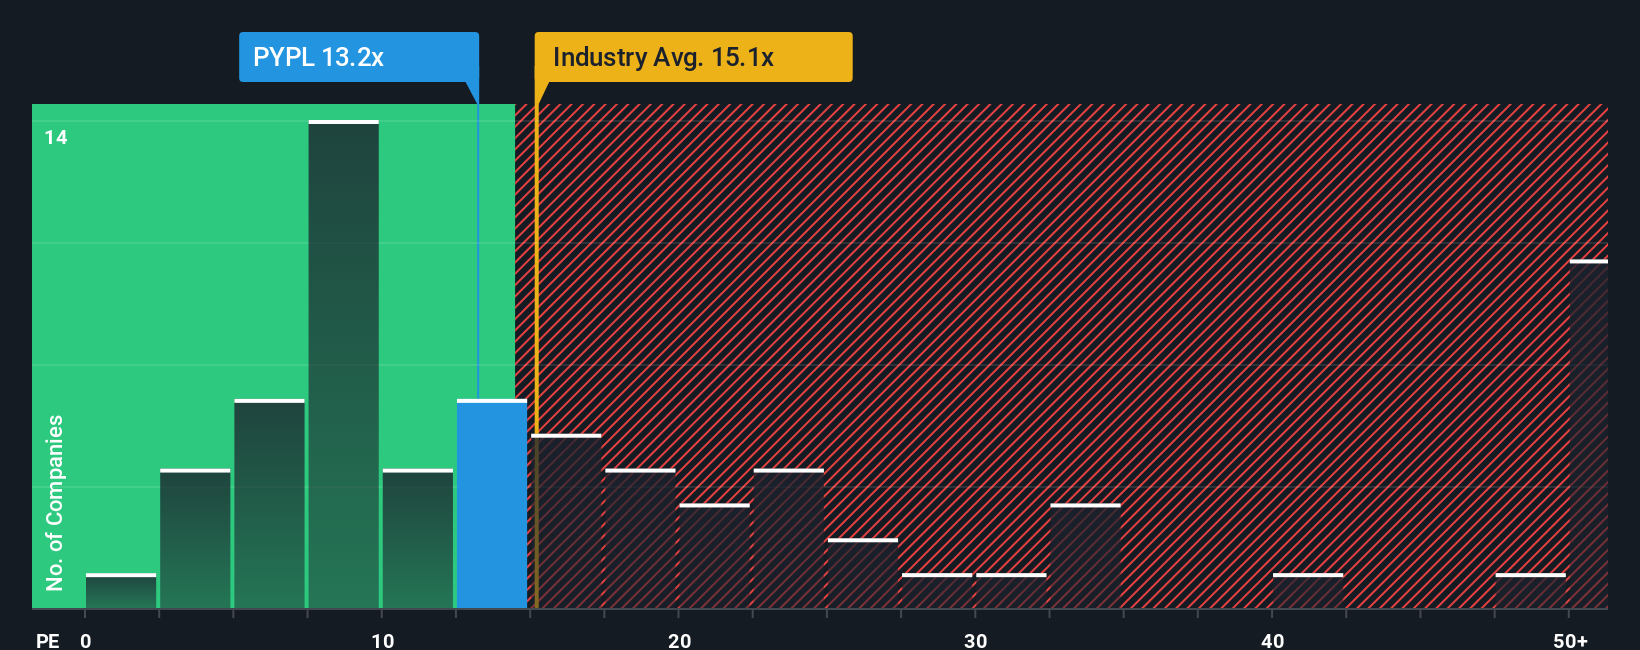
In general, companies with stronger growth outlooks and lower perceived risk are often associated with a higher, more typical PE multiple. Slower growth or higher uncertainty tends to align with a lower PE. PayPal currently trades on about 11.45x earnings, which is below the diversified financial industry average of roughly 13.57x and far below its peer group average of about 59.27x. This suggests the market is pricing it more cautiously than many alternatives.
Simply Wall St approaches this differently with its Fair Ratio, an estimate of what PE investors might reasonably pay given factors such as earnings growth, margins, risk profile, industry, and market cap. For PayPal, that Fair Ratio is 17.83x, which is more tailored than a simple industry or peer comparison because it adjusts for company specific characteristics. Set against the current 11.45x PE, this indicates the stock is trading at a discount to what its fundamentals may support.
Result: UNDERVALUED
PE ratios tell one story, but what if the real opportunity lies elsewhere? Discover 1455 companies where insiders are betting big on explosive growth.
Upgrade Your Decision Making: Choose your PayPal Holdings Narrative
Earlier we mentioned that there is an even better way to understand valuation, so let's introduce you to Narratives, a simple way to attach your own story about a company to the numbers behind your fair value, and your assumptions for future revenue, earnings and margins.
A Narrative links three things together: what you believe about a business, how that belief flows into a financial forecast, and the fair value that drops out of those assumptions, so you can see in one place why a stock looks cheap or expensive to you.
On Simply Wall St, Narratives are an easy, visual tool inside the Community page that millions of investors use to map their view of a company into forecasts and a fair value, then compare that Fair Value to the current Price to decide whether they want to buy, hold, or sell.
Because Narratives are updated dynamically when new information like earnings results or major news hits the market, you can quickly see how changes in PayPal’s outlook shift the fair value range, for example from a more optimistic view that it could be worth around $190 per share to a more cautious view nearer $82, and decide which perspective you agree with.
Do you think there's more to the story for PayPal Holdings? Head over to our Community to see what others are saying!
This article by Simply Wall St is general in nature. We provide commentary based on historical data and analyst forecasts only using an unbiased methodology and our articles are not intended to be financial advice. It does not constitute a recommendation to buy or sell any stock, and does not take account of your objectives, or your financial situation. We aim to bring you long-term focused analysis driven by fundamental data. Note that our analysis may not factor in the latest price-sensitive company announcements or qualitative material. Simply Wall St has no position in any stocks mentioned.
Have feedback on this article? Concerned about the content? Get in touch with us directly. Alternatively, email editorial-team@simplywallst.com