
- PREMIUM
- LIVE QUOTES
- INSTITUTIONS
 Index Options
 State Street
 CME Group
 Nasdaq
 Cboe
Cboe TradingView
 Wall Street Journal
KDX Realty Investment (TSE:8972) H1 2026 Revenue Uptick Tests Bearish Slow-Growth Narrative
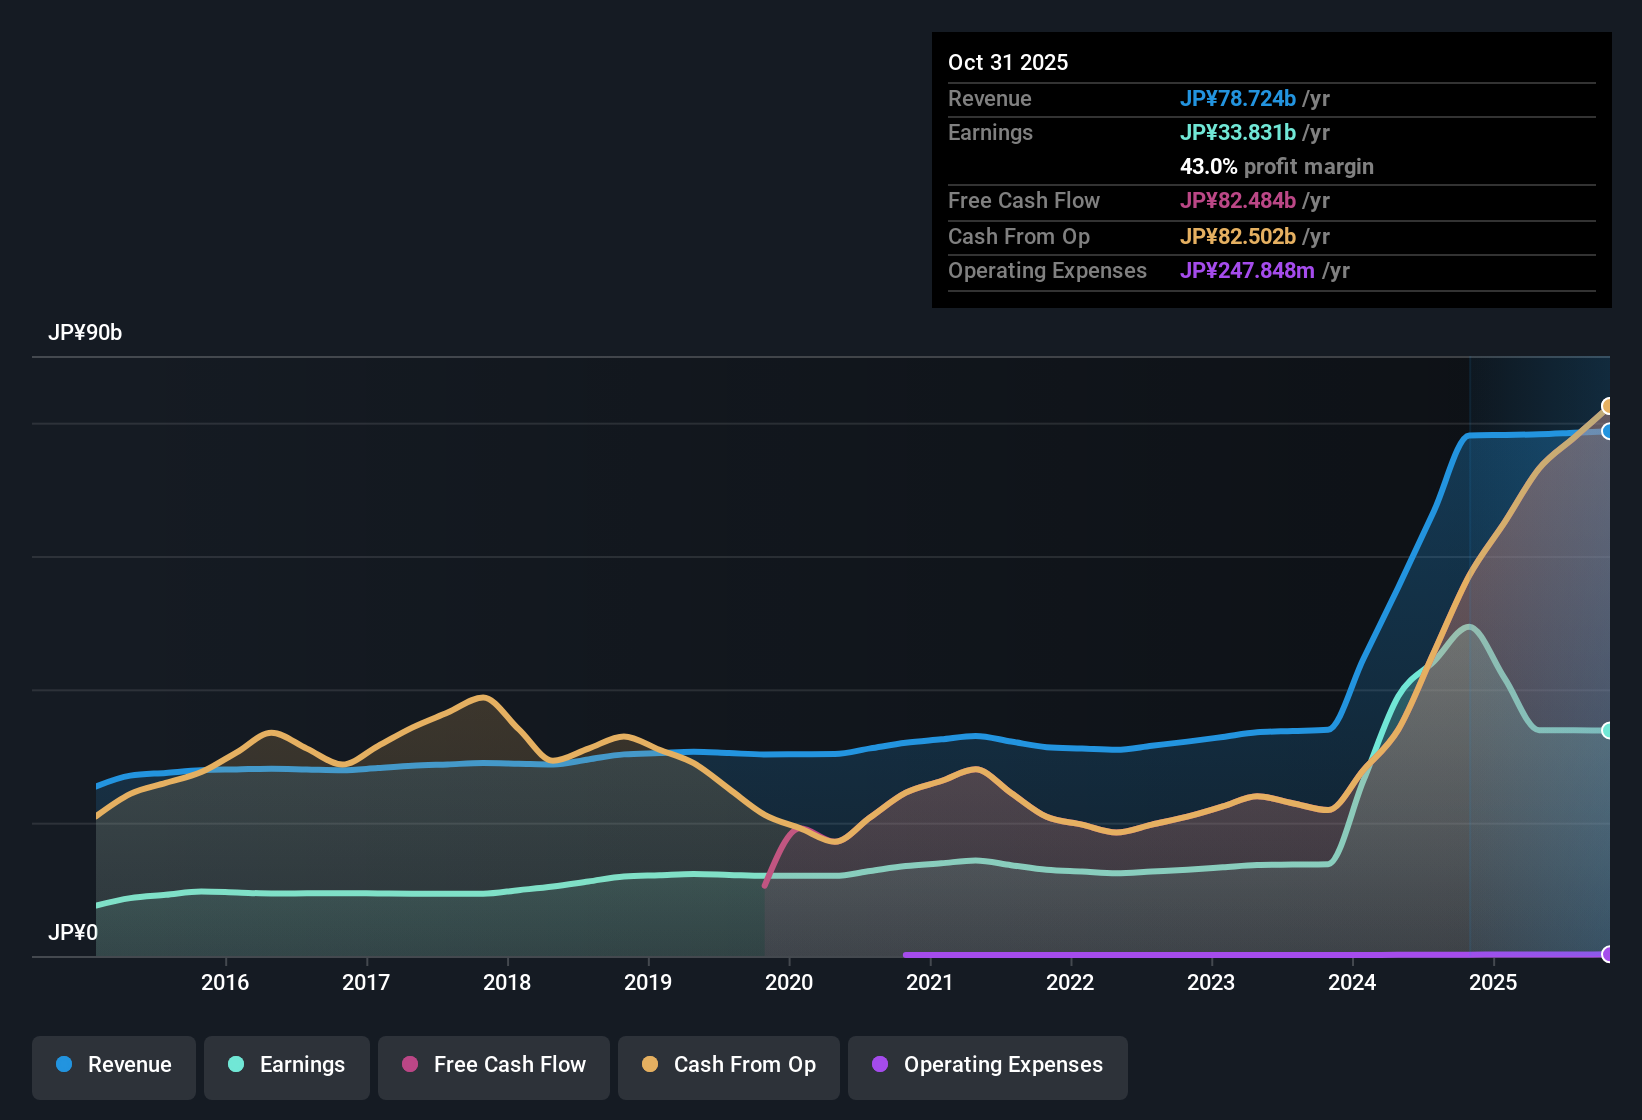
KDX Realty Investment (TSE:8972) just posted its H1 2026 numbers, with total revenue of about ¥39.9 billion and basic EPS of roughly ¥4,203, giving investors a clean snapshot of how the latest half-year is shaping up. The trust has seen revenue move from roughly ¥39.4 billion in H1 2025 to ¥39.9 billion in H1 2026, while basic EPS has stayed in a similar range at around ¥4,169 to ¥4,203 over the same period. This sets the stage for investors to focus on how margins are evolving beneath the surface.
See our full analysis for KDX Realty Investment.With the headline numbers on the table, the next step is to compare these results with the narratives investors have been leaning on, to see which stories hold up and which need a rethink.
Curious how numbers become stories that shape markets? Explore Community Narratives
Margins Slip Despite Strong Five Year Track
- Net profit margin over the last twelve months sits at 43 percent, down from 63.3 percent a year earlier, even though earnings had grown about 28.9 percent per year over the past five years.
- Bears argue that weakening profitability is a warning sign, and the margin drop from 63.3 percent to 43 percent clearly supports that concern, even though longer term earnings growth of roughly 28.9 percent a year shows the business has historically translated revenue into solid profits.
- What stands out is that this margin step down happened while trailing twelve month revenue was still high at about ¥78.7 billion, so the pressure is more about profitability than about a collapse in the top line.
- Critics also point to the modest 0.3 percent annual revenue growth forecast versus 4.6 percent for the broader JP market, arguing that slower growth plus thinner margins makes it harder to repeat that strong historical earnings pace.
Debt Coverage Emerges As Key Risk
- Analysis flags that debt is not well covered by operating cash flow, which is described as a major financial risk for the trust.
- Skeptics focus on this weak debt coverage as the central bearish point, and the data backs them up because the issue is framed as a major risk rather than a minor one. This suggests leverage could be more vulnerable if margins stay at around 43 percent instead of the prior 63.3 percent range.
- What is notable for a REIT is that this concern persists even though funds from operations over the last twelve months are around ¥41.3 billion, indicating that cash generation is sizeable in absolute terms but still not judged sufficient versus the debt load.
- Bears link the debt coverage problem with the recent margin compression, arguing that if profitability continues to trend lower while revenue growth runs at only about 0.3 percent a year, the balance sheet will have less room to absorb shocks.
DCF Signals Large Upside Gap
- The current share price of about ¥176,300 trades far below the DCF fair value estimate of roughly ¥517,347.48 and sits on a 21 times P E multiple that is slightly cheaper than peers at 22.1 times but a bit richer than the JP REITs industry average of 19.8 times.
- Supporters highlight this valuation setup as a bullish opportunity, and the roughly 65.9 percent discount to DCF fair value heavily supports that stance, especially when combined with a high and reliable 4.76 percent dividend yield and a five year earnings growth rate near 28.9 percent a year.
- What may surprise newer investors is that even with trailing margins down at 43 percent and modest 0.3 percent revenue growth expected, the discounted cash flow work still arrives at a value almost three times the current market price.
- At the same time, the P E of 21 times being only slightly below peers but above the broader REIT average shows that the market is not treating KDX as a distressed name. This keeps the bullish case very dependent on that large DCF upside actually being realized over time.
Next Steps
Don't just look at this quarter; the real story is in the long-term trend. We've done an in-depth analysis on KDX Realty Investment's growth and its valuation to see if today's price is a bargain. Add the company to your watchlist or portfolio now so you don't miss the next big move.
Explore Alternatives
KDX Realty Investment faces shrinking margins, soft top line growth, and flagged debt coverage issues, which raises questions about how resilient its balance sheet really is.
If that leverage risk makes you uneasy, use our solid balance sheet and fundamentals stocks screener (1943 results) today to quickly focus on businesses built on stronger finances, healthier cash coverage, and more durable downside protection.
This article by Simply Wall St is general in nature. We provide commentary based on historical data and analyst forecasts only using an unbiased methodology and our articles are not intended to be financial advice. It does not constitute a recommendation to buy or sell any stock, and does not take account of your objectives, or your financial situation. We aim to bring you long-term focused analysis driven by fundamental data. Note that our analysis may not factor in the latest price-sensitive company announcements or qualitative material. Simply Wall St has no position in any stocks mentioned.
Have feedback on this article? Concerned about the content? Get in touch with us directly. Alternatively, email editorial-team@simplywallst.com