
- PREMIUM
- LIVE QUOTES
- INSTITUTIONS
 Index Options
 State Street
 CME Group
 Nasdaq
 Cboe
Cboe TradingView
 Wall Street Journal
NSD (TSE:9759) Valuation Check After Higher November 2025 Sales Spark Fresh Investor Interest
NSD (TSE:9759) just posted preliminary November 2025 sales of ¥9,998 million, up from ¥9,089 million a year ago, with year-to-date sales also higher, giving investors fresh data to reassess the stock.
See our latest analysis for NSD.
The solid November sales update arrives while NSD’s share price has quietly climbed, with a roughly 6.9% 3 month share price return and a standout 3 year total shareholder return near 60%. This suggests underlying momentum is still intact.
If NSD’s steady progress has you thinking about what else the market might be rewarding, this could be the right moment to explore high growth tech and AI stocks.
But with the shares already up strongly over three and five years and trading only modestly below analyst targets, is NSD still an overlooked value story, or are investors already pricing in its next leg of growth?
Price-to-Earnings of 21.9x: Is it justified?
NSD closed at ¥3,509 and trades on a 21.9x price to earnings ratio, a level that suggests the market is paying up for its earnings stream.
The price to earnings multiple compares the current share price to the company’s per share profits, a common yardstick for profitable, mature IT services businesses like NSD. For a firm with steady growth and a long operating history, this ratio helps investors judge how much future earnings strength is already embedded in today’s price.
Against NSD’s fundamentals, the picture is mixed. The stock screens as good value versus its estimated fair price to earnings ratio of 23.5x, implying scope for the multiple to move higher if current trends in revenue and earnings growth persist. Yet at 21.9x, NSD is still more expensive than both its direct peers, which average 21.6x, and the broader Japanese IT industry at 16.9x, signaling that investors are already assigning a premium for its quality and consistency.
That industry gap is striking. A near 22x earnings multiple stands noticeably above the sector’s mid teens level, reinforcing the idea that NSD is priced as a higher quality or lower risk name than many of its IT peers, rather than a simple bargain on headline valuation alone.
Explore the SWS fair ratio for NSD
Result: Price-to-Earnings of 21.9x (ABOUT RIGHT)
However, NSD’s premium multiple could compress if sector growth cools or large enterprise clients delay IT spending, which would pressure both margins and sentiment.
Find out about the key risks to this NSD narrative.
Another View on Value
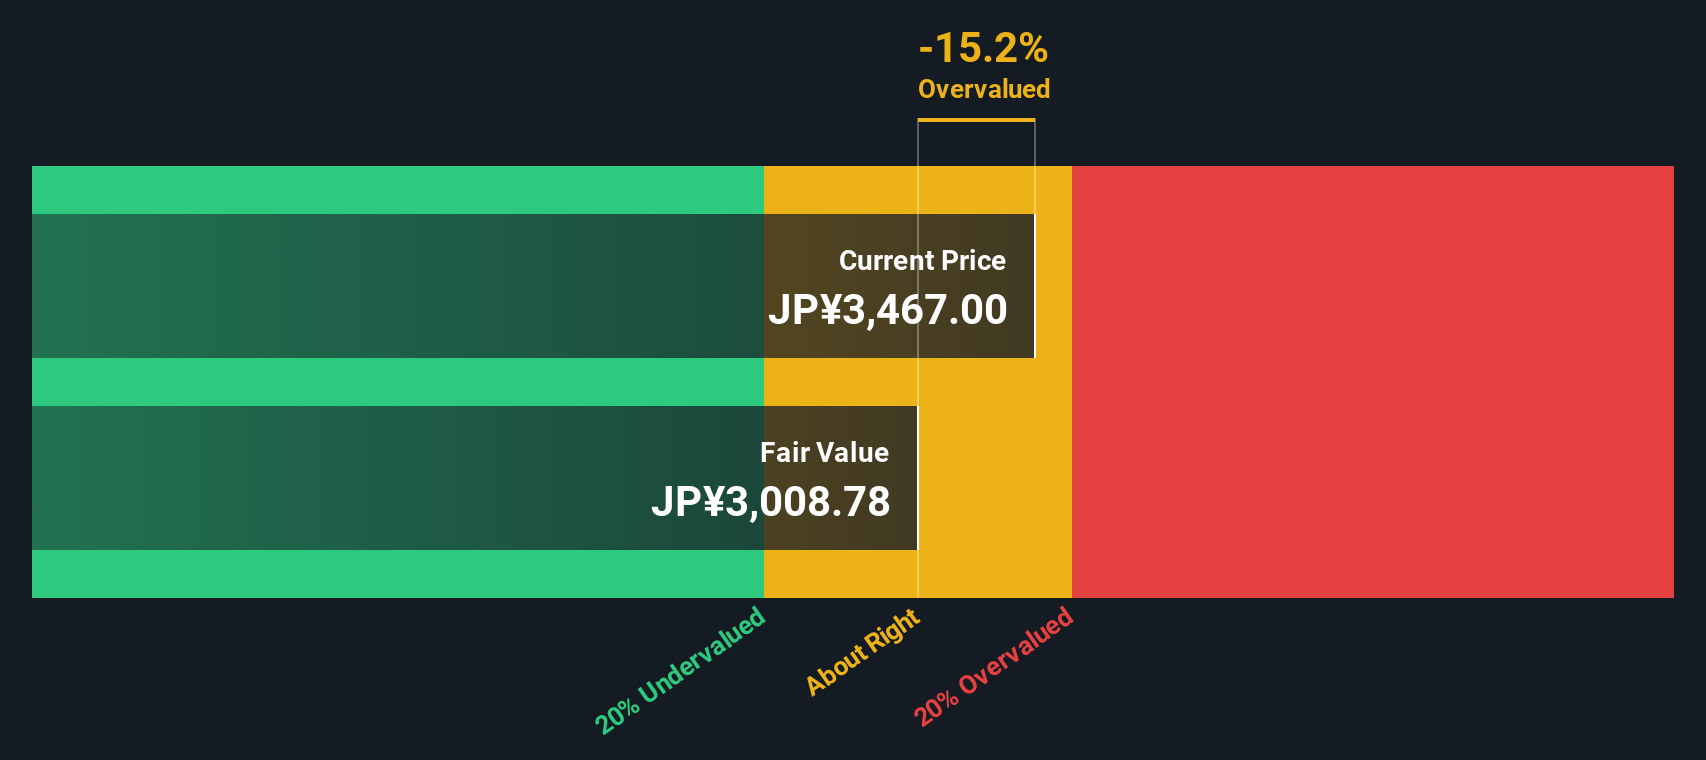
Our DCF model paints a different picture, suggesting NSD is around 15.9% undervalued versus its estimated fair value of ¥4,173.81. If earnings and cash flows keep tracking current forecasts, could today’s seemingly fully priced multiple still hide upside?
Look into how the SWS DCF model arrives at its fair value.
Simply Wall St performs a discounted cash flow (DCF) on every stock in the world every day (check out NSD for example). We show the entire calculation in full. You can track the result in your watchlist or portfolio and be alerted when this changes, or use our stock screener to discover 908 undervalued stocks based on their cash flows. If you save a screener we even alert you when new companies match - so you never miss a potential opportunity.
Build Your Own NSD Narrative
If you see the story differently or want to dig into the numbers yourself, you can build a full view in minutes: Do it your way.
A good starting point is our analysis highlighting 4 key rewards investors are optimistic about regarding NSD.
Looking for more investment ideas?
Do not stop with a single company when you can quickly scan the market for fresh opportunities. Use the Simply Wall Street Screener now and stay ahead.
- Capitalize on mispriced opportunities by tracking these 908 undervalued stocks based on cash flows that the market may be overlooking despite strong underlying cash flows.
- Ride powerful technology trends by reviewing these 26 AI penny stocks positioned to benefit from rapid advances in artificial intelligence.
- Lock in potential income streams by focusing on these 13 dividend stocks with yields > 3% that can support long term, yield driven portfolios.
This article by Simply Wall St is general in nature. We provide commentary based on historical data and analyst forecasts only using an unbiased methodology and our articles are not intended to be financial advice. It does not constitute a recommendation to buy or sell any stock, and does not take account of your objectives, or your financial situation. We aim to bring you long-term focused analysis driven by fundamental data. Note that our analysis may not factor in the latest price-sensitive company announcements or qualitative material. Simply Wall St has no position in any stocks mentioned.
Have feedback on this article? Concerned about the content? Get in touch with us directly. Alternatively, email editorial-team@simplywallst.com