
- PREMIUM
- LIVE QUOTES
- INSTITUTIONS
 Index Options
 State Street
 CME Group
 Nasdaq
 Cboe
Cboe TradingView
 Wall Street Journal
IGO (ASX:IGO) Extends Greenbushes JV: What Does This Mean for Its Lithium-Focused Valuation?
IGO (ASX:IGO) has doubled down on lithium by extending its joint venture at the Greenbushes project, a move that reinforces its long term bet on increased battery mineral demand and sector growth.
See our latest analysis for IGO.
The market seems to be warming back up to that strategy, with a 55.9% 3 month share price return and a 54.9% 1 year total shareholder return, even though the 3 year total shareholder return remains negative. This suggests momentum is rebuilding from a lower base.
If Greenbushes has you thinking more broadly about the energy transition, this could be a good moment to explore fast growing stocks with high insider ownership for other fast moving opportunities backed by committed insiders.
Yet with revenue under pressure, a recent share price surge and analysts split between Hold and Buy, the question is whether IGO is trading at a discount to its long term lithium potential or already pricing in a full recovery.
Price-to-Sales of 10.9x: Is it justified?
IGO's current A$7.59 share price implies a rich 10.9x price-to-sales multiple, which looks stretched against peers despite the recent share price recovery.
The price-to-sales ratio compares a company’s market value to its annual revenue, and for a miner like IGO it often reflects expectations for future commodity prices, project lifecycles and margins rather than current earnings.
Here, the market is paying a premium versus similar companies, with IGO described as expensive on a 10.9x price-to-sales basis compared with a 7.1x peer average. This suggests investors are pricing in a more robust turnaround and stronger lithium cycle than the rest of the group. That stands in stark contrast to the estimated fair price-to-sales ratio of just 0.2x, a level that implies the current valuation could compress significantly if sentiment cools or forecasts are revised.
Compared with the broader Australian Metals and Mining industry though, IGO still screens as good value, since its 10.9x price-to-sales ratio sits far below the sector’s lofty 123x average. This underlines how unusually elevated the wider industry’s revenue multiples have become.
Explore the SWS fair ratio for IGO
Result: Price-to-Sales of 10.9x (OVERVALUED)
However, investors must still weigh weak revenue growth and ongoing losses, which could indicate a longer road to sustainable returns than the market expects.
Find out about the key risks to this IGO narrative.
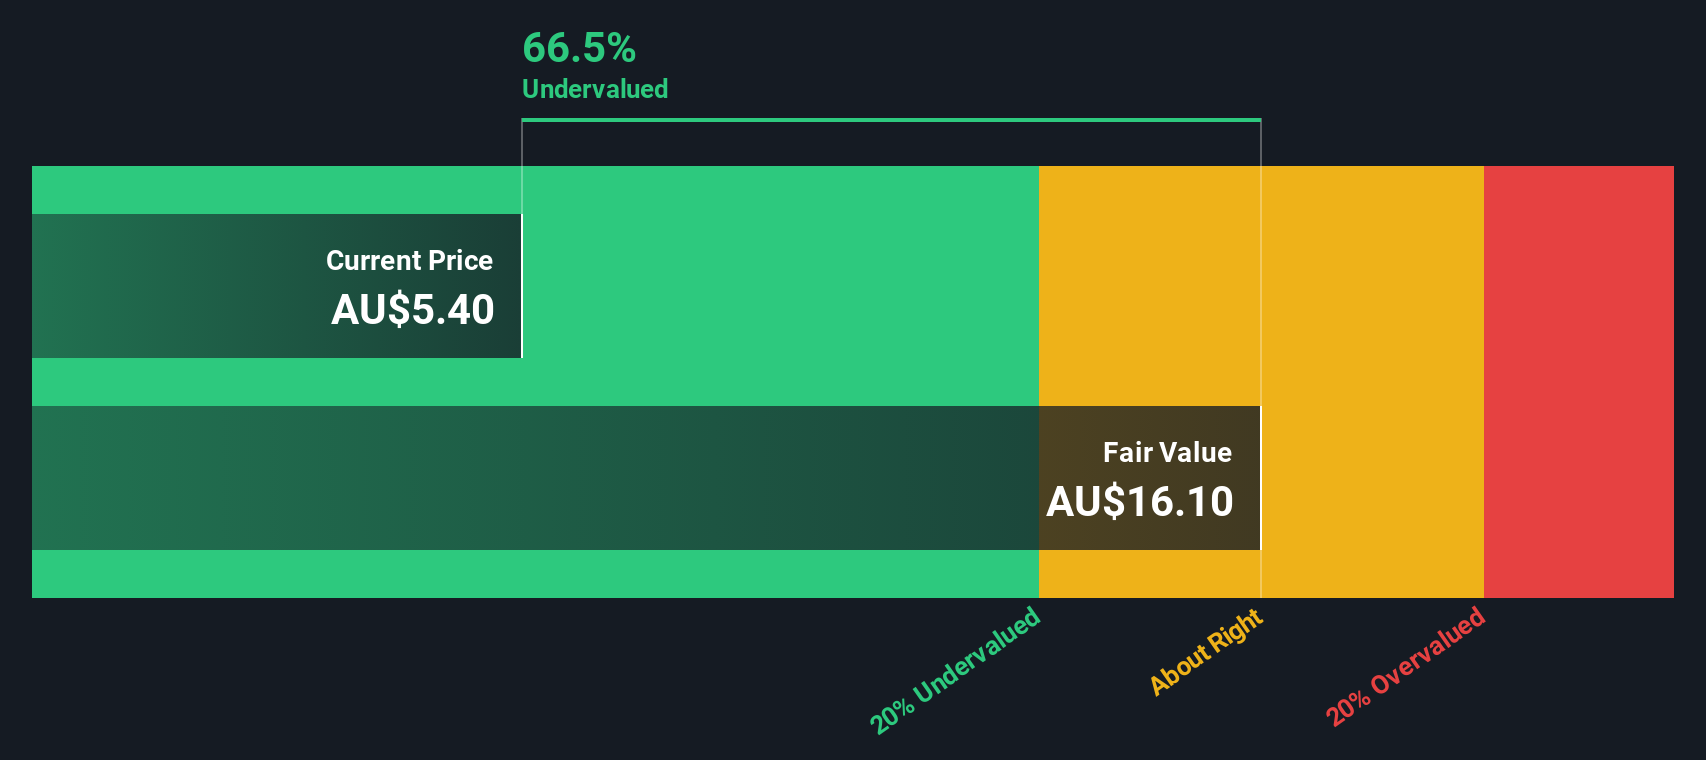
Another View: Our DCF Model Points the Other Way
While the 10.9x sales multiple looks stretched, our DCF model tells a different story and suggests fair value around A$10.01 versus the current A$7.59. That indicates IGO could be about 24% undervalued, so sentiment may still be lagging the recovery story.
Look into how the SWS DCF model arrives at its fair value.
Simply Wall St performs a discounted cash flow (DCF) on every stock in the world every day (check out IGO for example). We show the entire calculation in full. You can track the result in your watchlist or portfolio and be alerted when this changes, or use our stock screener to discover 908 undervalued stocks based on their cash flows. If you save a screener we even alert you when new companies match - so you never miss a potential opportunity.
Build Your Own IGO Narrative
If you see the numbers differently or want to dive deeper into the data, you can quickly build a personalised view in just minutes: Do it your way.
A good starting point is our analysis highlighting 2 key rewards investors are optimistic about regarding IGO.
Ready for your next opportunity?
If you stop with IGO, you risk missing out on other compelling setups. Use the Simply Wall St Screener to spot what others overlook.
- Capture potential mispricings by scanning these 908 undervalued stocks based on cash flows that the market may be overlooking today but could rerate sharply tomorrow.
- Tap into powerful secular themes by targeting these 26 AI penny stocks positioned to benefit from accelerating demand for intelligent automation and data driven tools.
- Strengthen your income stream by reviewing these 13 dividend stocks with yields > 3% that can add reliable cash flow alongside your growth focused bets.
This article by Simply Wall St is general in nature. We provide commentary based on historical data and analyst forecasts only using an unbiased methodology and our articles are not intended to be financial advice. It does not constitute a recommendation to buy or sell any stock, and does not take account of your objectives, or your financial situation. We aim to bring you long-term focused analysis driven by fundamental data. Note that our analysis may not factor in the latest price-sensitive company announcements or qualitative material. Simply Wall St has no position in any stocks mentioned.
Have feedback on this article? Concerned about the content? Get in touch with us directly. Alternatively, email editorial-team@simplywallst.com