
- PREMIUM
- LIVE QUOTES
- INSTITUTIONS
 Index Options
 State Street
 CME Group
 Nasdaq
 Cboe
Cboe TradingView
 Wall Street Journal
Oki Electric Industry (TSE:6703) Valuation After New AI Cables and Zero-Energy IoT Rail Success
Oki Electric Industry (TSE:6703) is back on radar after two intertwined updates: new high speed machine vision cables for AI robotics and smart factories, plus successful zero energy IoT trials on Indonesian railways.
See our latest analysis for Oki Electric Industry.
These updates land after a powerful run, with the latest ¥1,827 share price sitting on a 76.2% year to date share price return and a standout 79.1% one year total shareholder return. This signals strong momentum behind Oki’s automation and infrastructure story despite some recent short term cooling.
If these moves have your attention, it could be worth exploring other high growth tech and AI names via high growth tech and AI stocks to spot the next wave of potential winners.
After such powerful gains and a modest premium to analyst targets, has Oki Electric’s pivot to AI cables and zero energy IoT left more upside on the table, or is the market already pricing in most of its future growth?
Price to Earnings of 14.8x: Is it justified?
Oki Electric Industry trades at a price to earnings ratio of 14.8 times, slightly richer than both its electronic peers and the broader Japanese electronic industry.
The price to earnings multiple compares the current share price to the company’s earnings per share, making it a core yardstick for mature, profit generating tech and electronics businesses like Oki. A higher multiple typically reflects stronger growth expectations or higher perceived quality of earnings.
In Oki’s case, the 14.8 times earnings tag is a touch above the JP Electronic industry average of 14.6 times, but still below the estimated fair price to earnings ratio of 19.9 times derived from the SWS fair ratio framework. That combination suggests the market is paying a mild premium to the sector today, yet still discounts the level that longer term fundamentals might justify if forecast earnings growth materialises.
Compared with the peer group average multiple of 15.4 times, Oki’s 14.8 times price to earnings sits at a small discount, underscoring how its valuation is tightly clustered around sector norms rather than priced as an outlier growth story.
Explore the SWS fair ratio for Oki Electric Industry
Result: Price to Earnings of 14.8x (ABOUT RIGHT)
However, downside risks remain, including slower than expected AI cable orders or delays in scaling zero energy IoT deployments that could temper the growth premium.
Find out about the key risks to this Oki Electric Industry narrative.
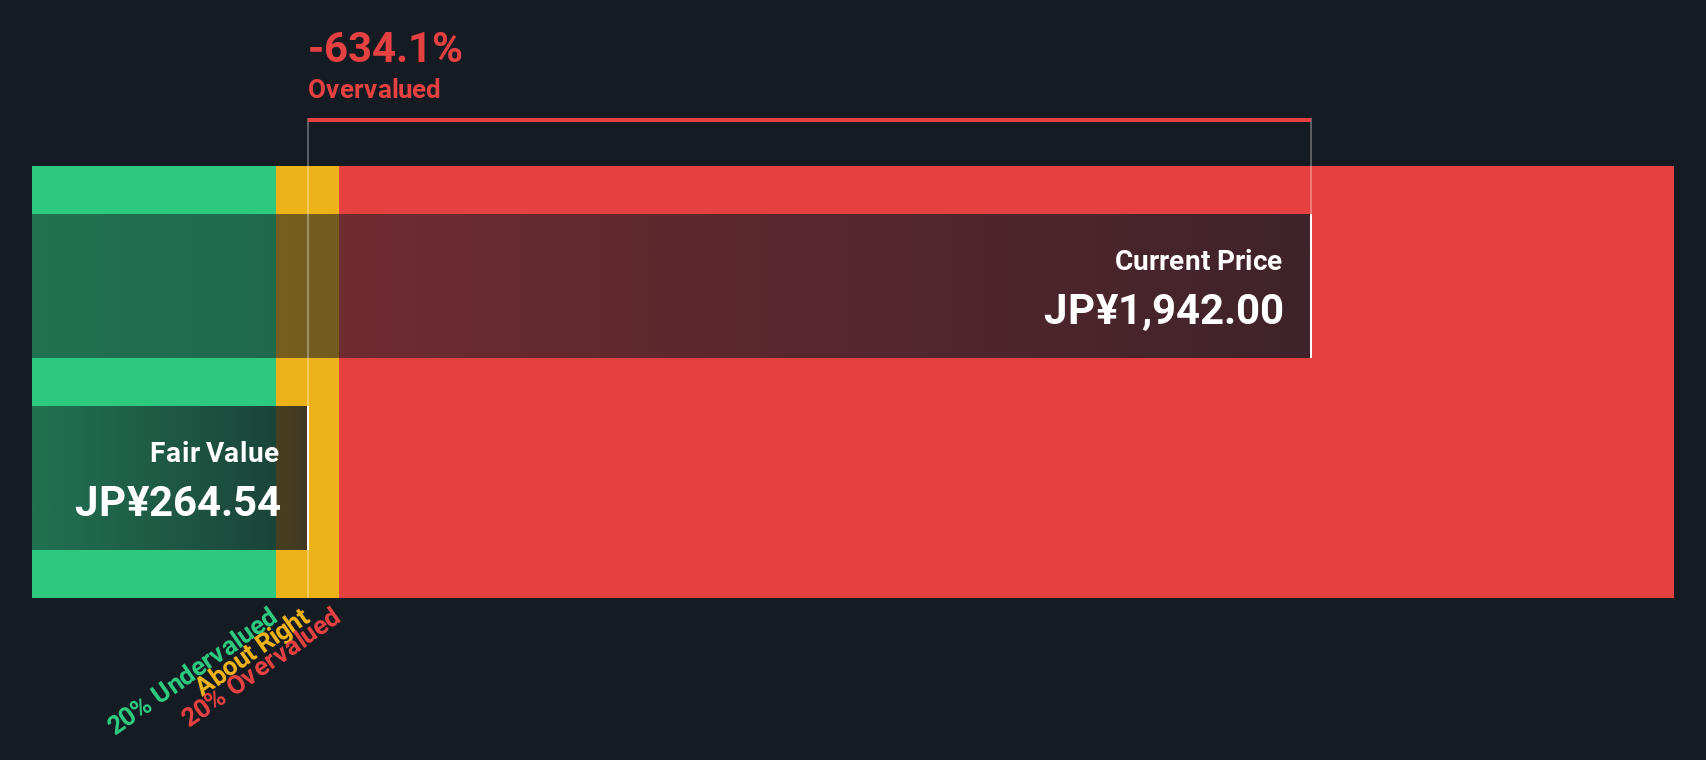
Another View: DCF Flashes a Stark Warning
Our DCF model paints a very different picture, with Oki Electric’s fair value estimated at roughly ¥264 versus the current ¥1,827 share price. That implies the stock could be trading at a steep premium. This raises the question: how much future growth is already priced in?
Look into how the SWS DCF model arrives at its fair value.
Simply Wall St performs a discounted cash flow (DCF) on every stock in the world every day (check out Oki Electric Industry for example). We show the entire calculation in full. You can track the result in your watchlist or portfolio and be alerted when this changes, or use our stock screener to discover 908 undervalued stocks based on their cash flows. If you save a screener we even alert you when new companies match - so you never miss a potential opportunity.
Build Your Own Oki Electric Industry Narrative
If you see the story differently or want to dig into the numbers yourself, you can build a custom narrative in minutes, Do it your way.
A great starting point for your Oki Electric Industry research is our analysis highlighting 1 key reward and 4 important warning signs that could impact your investment decision.
Ready for more investing opportunities?
Do not stop at Oki Electric. Your next investing idea could be waiting in another corner of the market, and you may not want to overlook it.
- Explore potential growth in under the radar names by targeting these 3639 penny stocks with strong financials that pair small size with relatively strong fundamentals.
- Consider the AI theme by reviewing these 26 AI penny stocks that are involved in the adoption of AI across industries.
- Look for possible mispricings by examining these 908 undervalued stocks based on cash flows where company cash flows may not be fully reflected in share prices.
This article by Simply Wall St is general in nature. We provide commentary based on historical data and analyst forecasts only using an unbiased methodology and our articles are not intended to be financial advice. It does not constitute a recommendation to buy or sell any stock, and does not take account of your objectives, or your financial situation. We aim to bring you long-term focused analysis driven by fundamental data. Note that our analysis may not factor in the latest price-sensitive company announcements or qualitative material. Simply Wall St has no position in any stocks mentioned.
Have feedback on this article? Concerned about the content? Get in touch with us directly. Alternatively, email editorial-team@simplywallst.com