
- PREMIUM
- LIVE QUOTES
- INSTITUTIONS
 Index Options
 State Street
 CME Group
 Nasdaq
 Cboe
Cboe TradingView
 Wall Street Journal
3 Undervalued Small Caps With Insider Buying Across Regions
In the current U.S. market landscape, small-cap stocks have been navigating mixed signals as major indices like the S&P 500 and Dow Jones show declines following unexpected unemployment data, while the Nasdaq edges upward. Amid these fluctuations, identifying promising small-cap opportunities involves assessing factors such as insider buying trends and regional economic conditions that may offer potential for growth or resilience in a shifting economic environment.
Top 10 Undervalued Small Caps With Insider Buying In The United States
| Name | PE | PS | Discount to Fair Value | Value Rating |
|---|---|---|---|---|
| Shore Bancshares | 11.0x | 2.9x | 38.14% | ★★★★★☆ |
| Peoples Bancorp | 11.0x | 2.0x | 41.97% | ★★★★★☆ |
| Merchants Bancorp | 8.3x | 2.8x | 47.15% | ★★★★★☆ |
| Innovative Industrial Properties | 13.6x | 5.9x | 45.53% | ★★★★★☆ |
| Metropolitan Bank Holding | 13.1x | 3.2x | 28.23% | ★★★★☆☆ |
| First United | 10.7x | 3.2x | 41.53% | ★★★★☆☆ |
| Angel Oak Mortgage REIT | 12.5x | 6.3x | 43.13% | ★★★★☆☆ |
| S&T Bancorp | 12.1x | 4.1x | 33.42% | ★★★☆☆☆ |
| Farmland Partners | 6.8x | 8.4x | -100.17% | ★★★☆☆☆ |
| Vestis | NA | 0.3x | -12.41% | ★★★☆☆☆ |
Let's review some notable picks from our screened stocks.
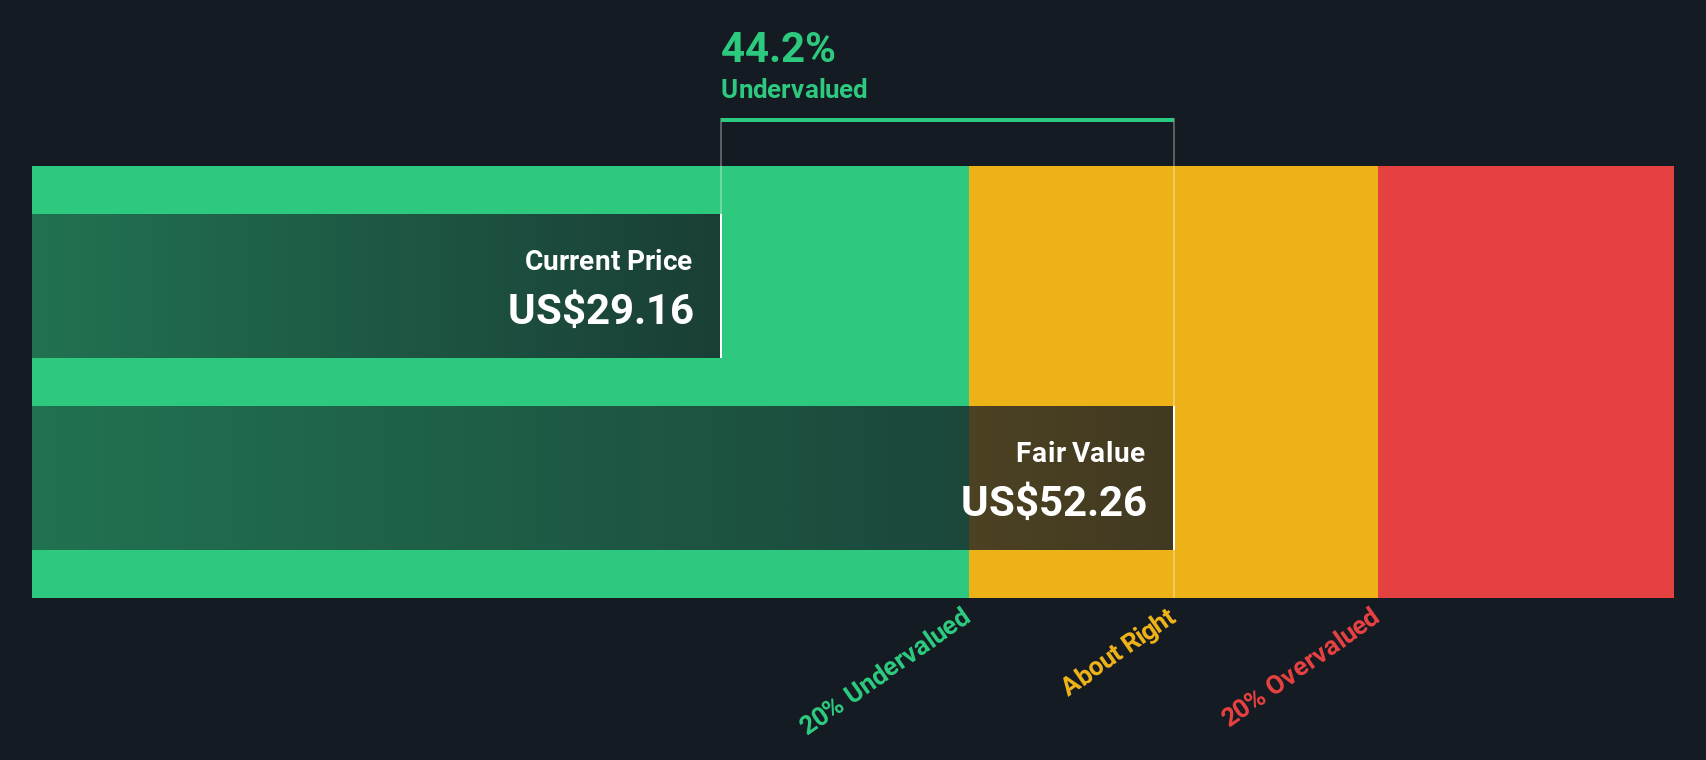
Mid Penn Bancorp (MPB)
Simply Wall St Value Rating: ★★★☆☆☆
Overview: Mid Penn Bancorp operates as a financial institution providing banking and financial services to individuals, businesses, and institutional clients with a market cap of approximately $0.43 billion.
Operations: Mid Penn Bancorp's revenue is primarily derived from banking and financial services to individuals, businesses, and institutional clients, totaling $208.87 million in the latest period. The company has consistently achieved a gross profit margin of 100%, indicating no cost of goods sold is reported. Operating expenses have been a significant component of costs, with general and administrative expenses making up a substantial portion at $104.60 million in the most recent period. Net income margin has shown variability over time, reaching 23.95% recently.
PE: 15.0x
Mid Penn Bancorp, a smaller player in the financial sector, has shown promising signs of value with recent insider confidence demonstrated through share purchases. The company reported strong third-quarter results with net interest income rising to US$53.63 million from US$40.17 million a year ago, while net income increased to US$18.3 million from US$12.3 million. Additionally, they announced a 10% dividend increase and completed a significant share buyback program worth US$11.77 million since March 2020, indicating strategic capital management amidst forecasted earnings growth of 33.74% annually.
- Delve into the full analysis valuation report here for a deeper understanding of Mid Penn Bancorp.
Understand Mid Penn Bancorp's track record by examining our Past report.
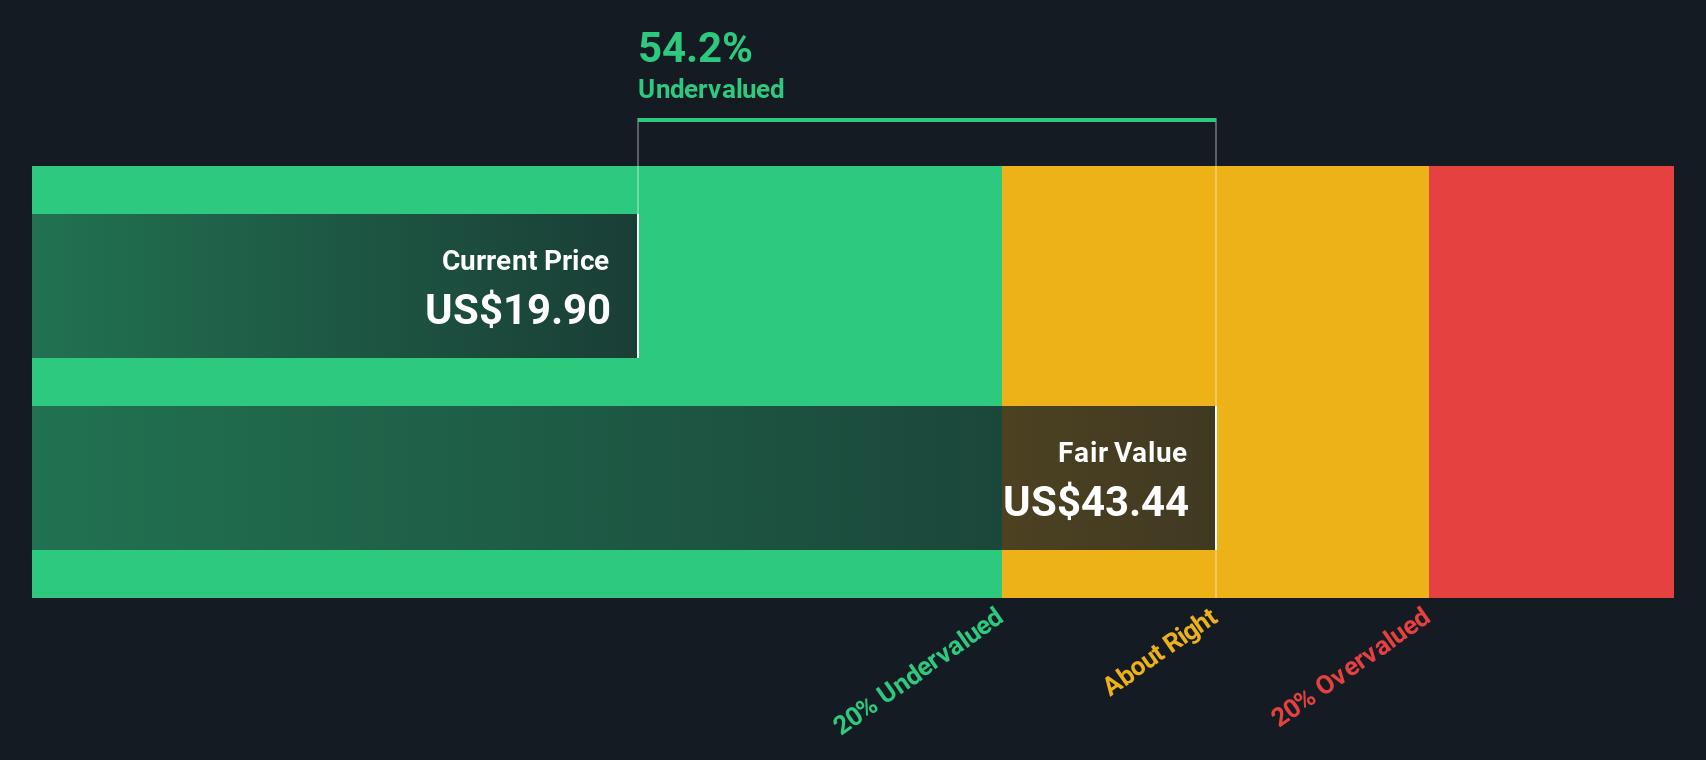
Ategrity Specialty Insurance Company Holdings (ASIC)
Simply Wall St Value Rating: ★★★★☆☆
Overview: Ategrity Specialty Insurance Company Holdings operates in the insurance industry, focusing on specialty insurance products, with a market capitalization of $1.25 billion.
Operations: ASIC generates revenue primarily from its insurance business, with the latest reported figure at $405.66 million. The company's cost of goods sold (COGS) for the same period was $307.14 million, resulting in a gross profit margin of 24.29%. Operating expenses were recorded at $2.91 million, while non-operating expenses amounted to $26.22 million, impacting overall profitability and net income figures over time.
PE: 14.1x
Ategrity Specialty Insurance Company Holdings, a growing player in the insurance sector, has recently reported significant financial improvements. For Q3 2025, revenue rose to US$116.1 million from US$88.75 million year-over-year, with net income climbing to US$22.66 million from US$12.86 million. Their innovative Ategrity Select platform targets religious organizations and enhances underwriting efficiency for small businesses by pre-qualifying over 200,000 institutions across the U.S., potentially driving future growth and profitability in this niche market segment.
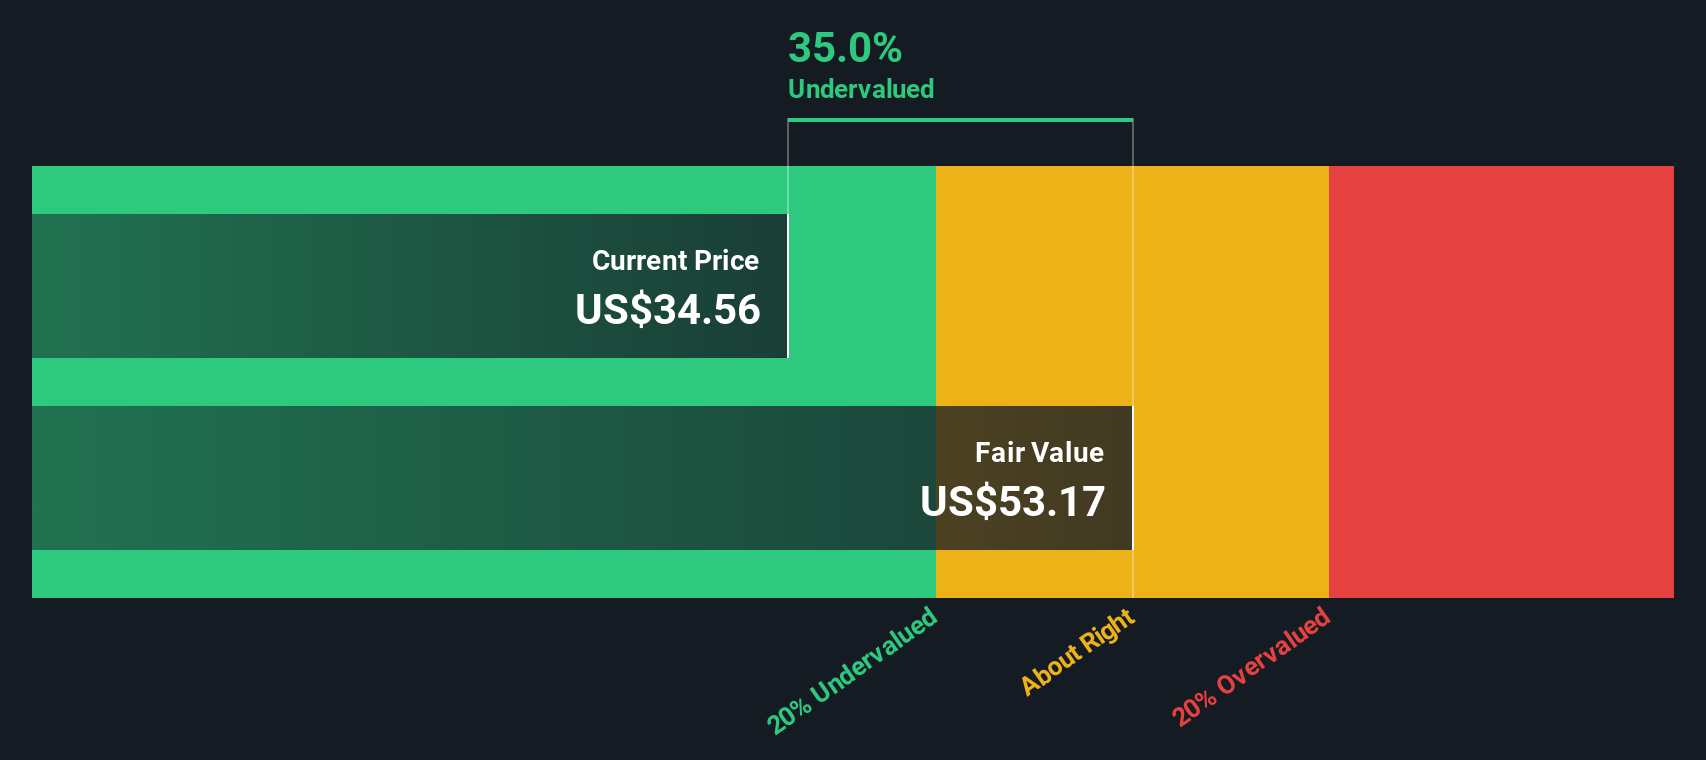
Saul Centers (BFS)
Simply Wall St Value Rating: ★★★☆☆☆
Overview: Saul Centers is a real estate investment trust that operates shopping centers and mixed-use properties, with a market capitalization of approximately $1.22 billion.
Operations: The company generates revenue primarily from Shopping Centers and Mixed-Use Properties, with Shopping Centers contributing a larger portion. Cost of Goods Sold (COGS) consistently impacts gross profit, which was $202.38 million in the most recent period. The gross profit margin has shown a declining trend, reaching 71.61% by the end of 2025. Operating expenses and non-operating expenses are significant components of its cost structure, affecting overall profitability.
PE: 28.1x
Saul Centers, a smaller company in the U.S., has seen recent insider confidence with share purchases, indicating potential optimism. Despite a dip in net income to US$10.49 million for Q3 2025 from US$14.48 million the previous year, sales increased to US$70.68 million from US$65.55 million, suggesting revenue growth despite slimmer profit margins of 9.9% compared to last year's 16.7%. The company's steady dividend payouts and stable financial footing highlight its resilience amid external borrowing challenges and executive changes like John E. Chapoton's board resignation on November 25, 2025.
- Get an in-depth perspective on Saul Centers' performance by reading our valuation report here.
Gain insights into Saul Centers' past trends and performance with our Past report.
Where To Now?
- Access the full spectrum of 72 Undervalued US Small Caps With Insider Buying by clicking on this link.
- Are these companies part of your investment strategy? Use Simply Wall St to consolidate your holdings into a portfolio and gain insights with our comprehensive analysis tools.
- Join a community of smart investors by using Simply Wall St. It's free and delivers expert-level analysis on worldwide markets.
Looking For Alternative Opportunities?
- Explore high-performing small cap companies that haven't yet garnered significant analyst attention.
- Fuel your portfolio with companies showing strong growth potential, backed by optimistic outlooks both from analysts and management.
- Find companies with promising cash flow potential yet trading below their fair value.
This article by Simply Wall St is general in nature. We provide commentary based on historical data and analyst forecasts only using an unbiased methodology and our articles are not intended to be financial advice. It does not constitute a recommendation to buy or sell any stock, and does not take account of your objectives, or your financial situation. We aim to bring you long-term focused analysis driven by fundamental data. Note that our analysis may not factor in the latest price-sensitive company announcements or qualitative material. Simply Wall St has no position in any stocks mentioned.
Have feedback on this article? Concerned about the content? Get in touch with us directly. Alternatively, email editorial-team@simplywallst.com