
- PREMIUM
- LIVE QUOTES
- INSTITUTIONS
 Index Options
 State Street
 CME Group
 Nasdaq
 Cboe
Cboe TradingView
 Wall Street Journal
Has Ollie's Rally Justified Its Valuation After Recent 10% Pullback?
- If you have ever wondered whether Ollie's Bargain Outlet Holdings is still a bargain at today’s price, you are not alone. This stock divides opinion between value hunters and growth-focused investors.
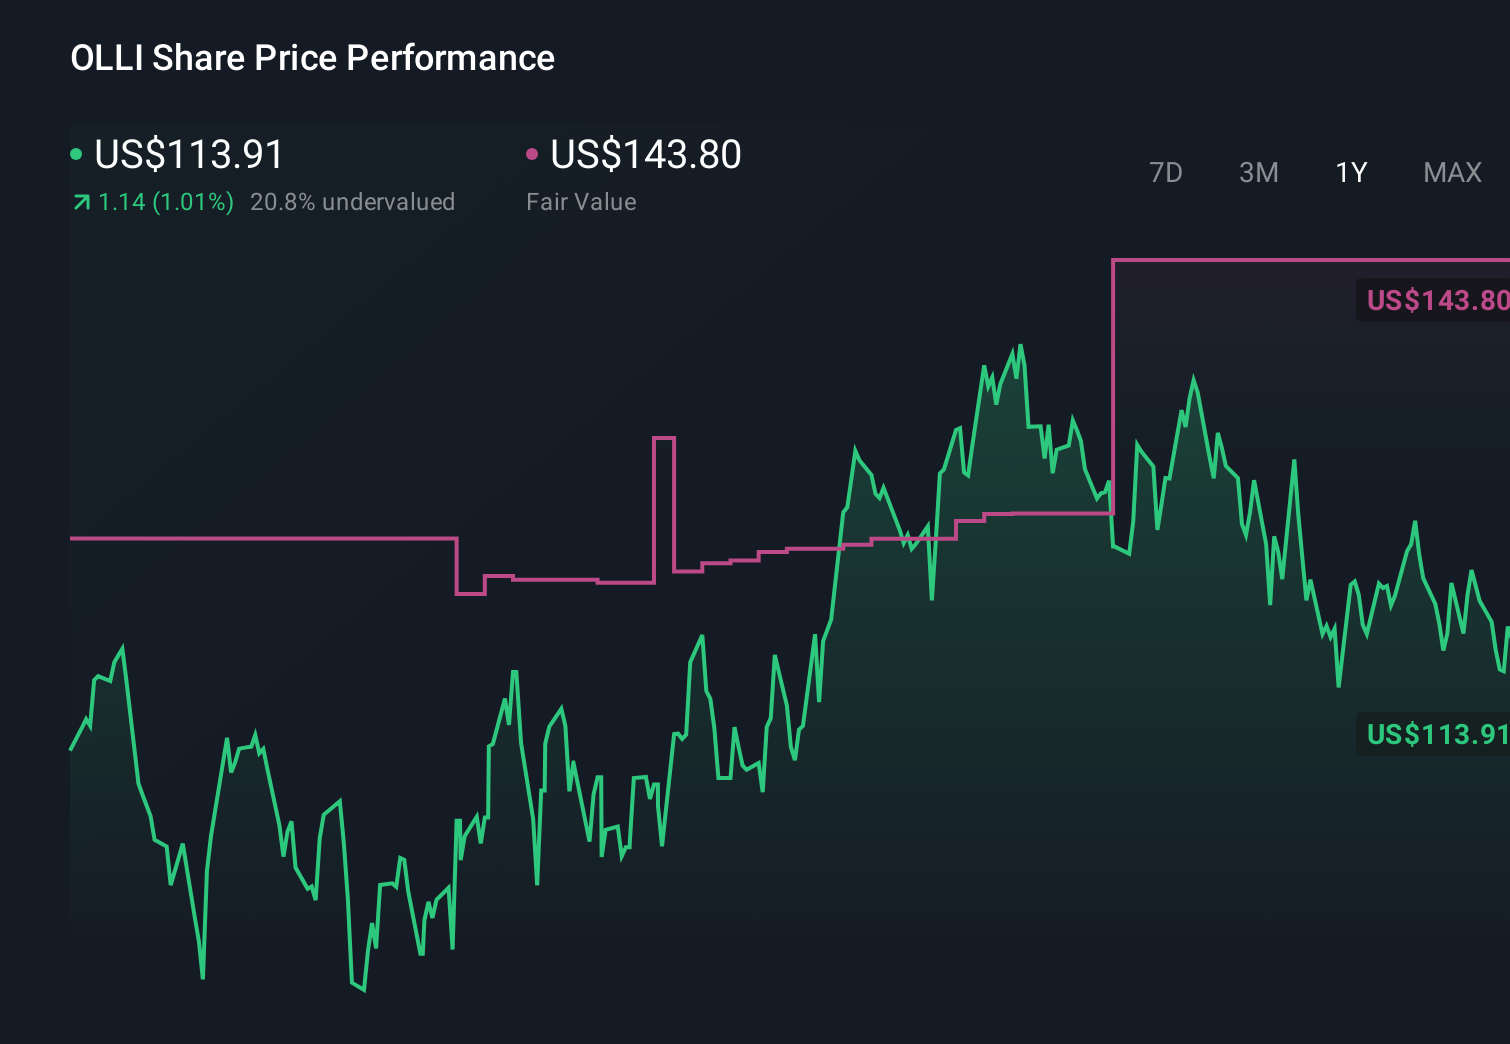
- The share price has slipped recently, down around 5.9% over the last week and 10.0% over the past month. Yet it is still up 1.0% year to date and an eye catching 140.2% over three years.
- Investors have been digesting a steady stream of commentary around the broader discount retail space, including ongoing debates about how resilient value focused shoppers will be if economic conditions soften further. At the same time, market chatter has highlighted Ollie’s store expansion plans and merchandising strategy as key drivers that could either justify the past multi year rally or expose the stock if expectations prove too optimistic.
- Right now, our checklist driven valuation view gives Ollie’s a score of 1 out of 6. This suggests it screens as undervalued on only one of six traditional tests. Next we will walk through those valuation methods before finishing with a more comprehensive way to think about what the stock is really worth.
Ollie's Bargain Outlet Holdings scores just 1/6 on our valuation checks. See what other red flags we found in the full valuation breakdown.
Approach 1: Ollie's Bargain Outlet Holdings Discounted Cash Flow (DCF) Analysis
A Discounted Cash Flow, or DCF, model estimates what a company is worth today by projecting the cash it could generate in the future and discounting those cash flows back to the present.
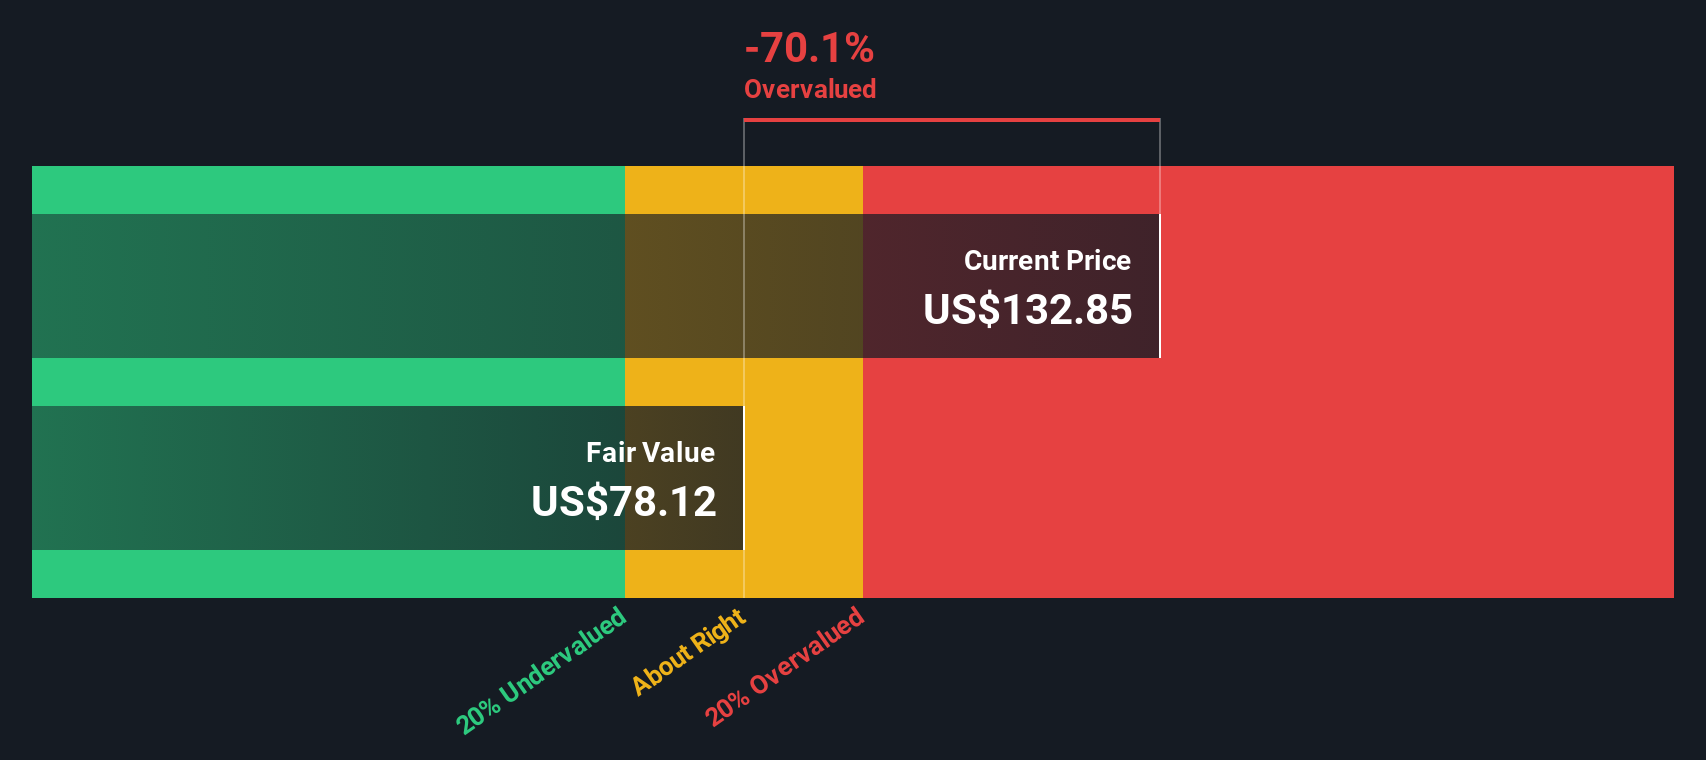
For Ollie's Bargain Outlet Holdings, the model starts with last twelve months Free Cash Flow of about $134 million and uses a 2 Stage Free Cash Flow to Equity framework. Analysts provide detailed forecasts for the next few years, with Simply Wall St extrapolating further out, so projected Free Cash Flow reaches roughly $369 million by 2035. All of these future cash flows are discounted back to today to arrive at an estimated intrinsic value of about $78.79 per share.
Compared with the current share price, the DCF suggests the stock is around 38.8% above that estimate of intrinsic value. This indicates that expectations for future growth are already reflected in the price, which may reduce the margin of safety for new buyers.
Result: OVERVALUED
Our Discounted Cash Flow (DCF) analysis suggests Ollie's Bargain Outlet Holdings may be overvalued by 38.8%. Discover 912 undervalued stocks or create your own screener to find better value opportunities.
Approach 2: Ollie's Bargain Outlet Holdings Price vs Earnings
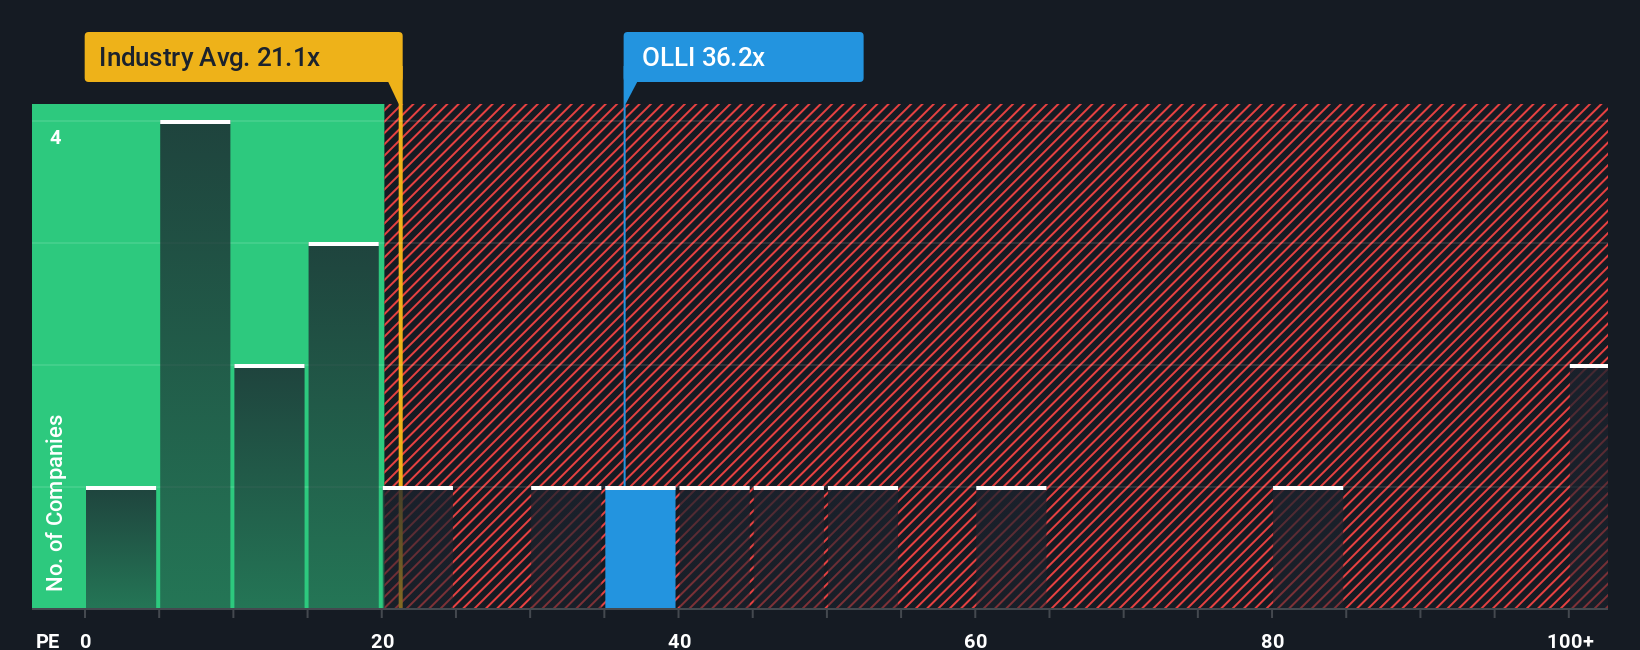
For profitable companies like Ollie's Bargain Outlet Holdings, the Price to Earnings (PE) ratio is a useful way to gauge how much investors are willing to pay for each dollar of current earnings. In general, higher expected growth and lower perceived risk justify a higher PE, while slower growth or elevated risk usually call for a lower, more conservative multiple.
Ollie’s currently trades on a PE of about 30.0x, which is well above both the Multiline Retail industry average of roughly 19.7x and a peer group average of about 17.7x. On those simple comparisons, the stock looks expensive. However, Simply Wall St’s Fair Ratio framework goes a step further by estimating what PE multiple would be reasonable given Ollie’s specific earnings growth outlook, profitability profile, industry, market cap and risk characteristics.
That Fair Ratio for Ollie’s is around 19.0x, meaning the shares trade at a noticeably richer valuation than what those fundamentals would usually support. Because this approach adjusts for growth, risks and margins, it offers a more tailored benchmark than blunt peer or industry averages, and on this basis the stock appears priced for very optimistic outcomes.
Result: OVERVALUED
PE ratios tell one story, but what if the real opportunity lies elsewhere? Discover 1463 companies where insiders are betting big on explosive growth.
Upgrade Your Decision Making: Choose your Ollie's Bargain Outlet Holdings Narrative
Earlier we mentioned that there is an even better way to understand valuation, so let us introduce you to Narratives, a simple tool on Simply Wall St’s Community page that lets you connect your view of a company’s story with your own forecast for its future revenue, earnings and margins. You can then translate that into a Fair Value you can compare to today’s price to help decide whether to buy or sell. The Narrative automatically updates as new news or earnings arrive. For example, one Ollie’s investor might plug in strong macro tailwinds, sustained double digit growth and a premium multiple and reach a Fair Value closer to the most bullish target of about $159, while a more cautious investor might assume slower store expansion, margin pressure and a lower multiple and land near the most bearish target around $130.
Do you think there's more to the story for Ollie's Bargain Outlet Holdings? Head over to our Community to see what others are saying!
This article by Simply Wall St is general in nature. We provide commentary based on historical data and analyst forecasts only using an unbiased methodology and our articles are not intended to be financial advice. It does not constitute a recommendation to buy or sell any stock, and does not take account of your objectives, or your financial situation. We aim to bring you long-term focused analysis driven by fundamental data. Note that our analysis may not factor in the latest price-sensitive company announcements or qualitative material. Simply Wall St has no position in any stocks mentioned.
Have feedback on this article? Concerned about the content? Get in touch with us directly. Alternatively, email editorial-team@simplywallst.com