
- PREMIUM
- LIVE QUOTES
- INSTITUTIONS
 Index Options
 State Street
 CME Group
 Nasdaq
 Cboe
Cboe TradingView
 Wall Street Journal
Has the Market Run Too Far Ahead of Huntington After Its Strong Five Year Rally?
- Wondering whether Huntington Bancshares is still a buy at today's price, or if the easy gains are already behind it? This breakdown will help you decide, using a clear, valuation-first lens.
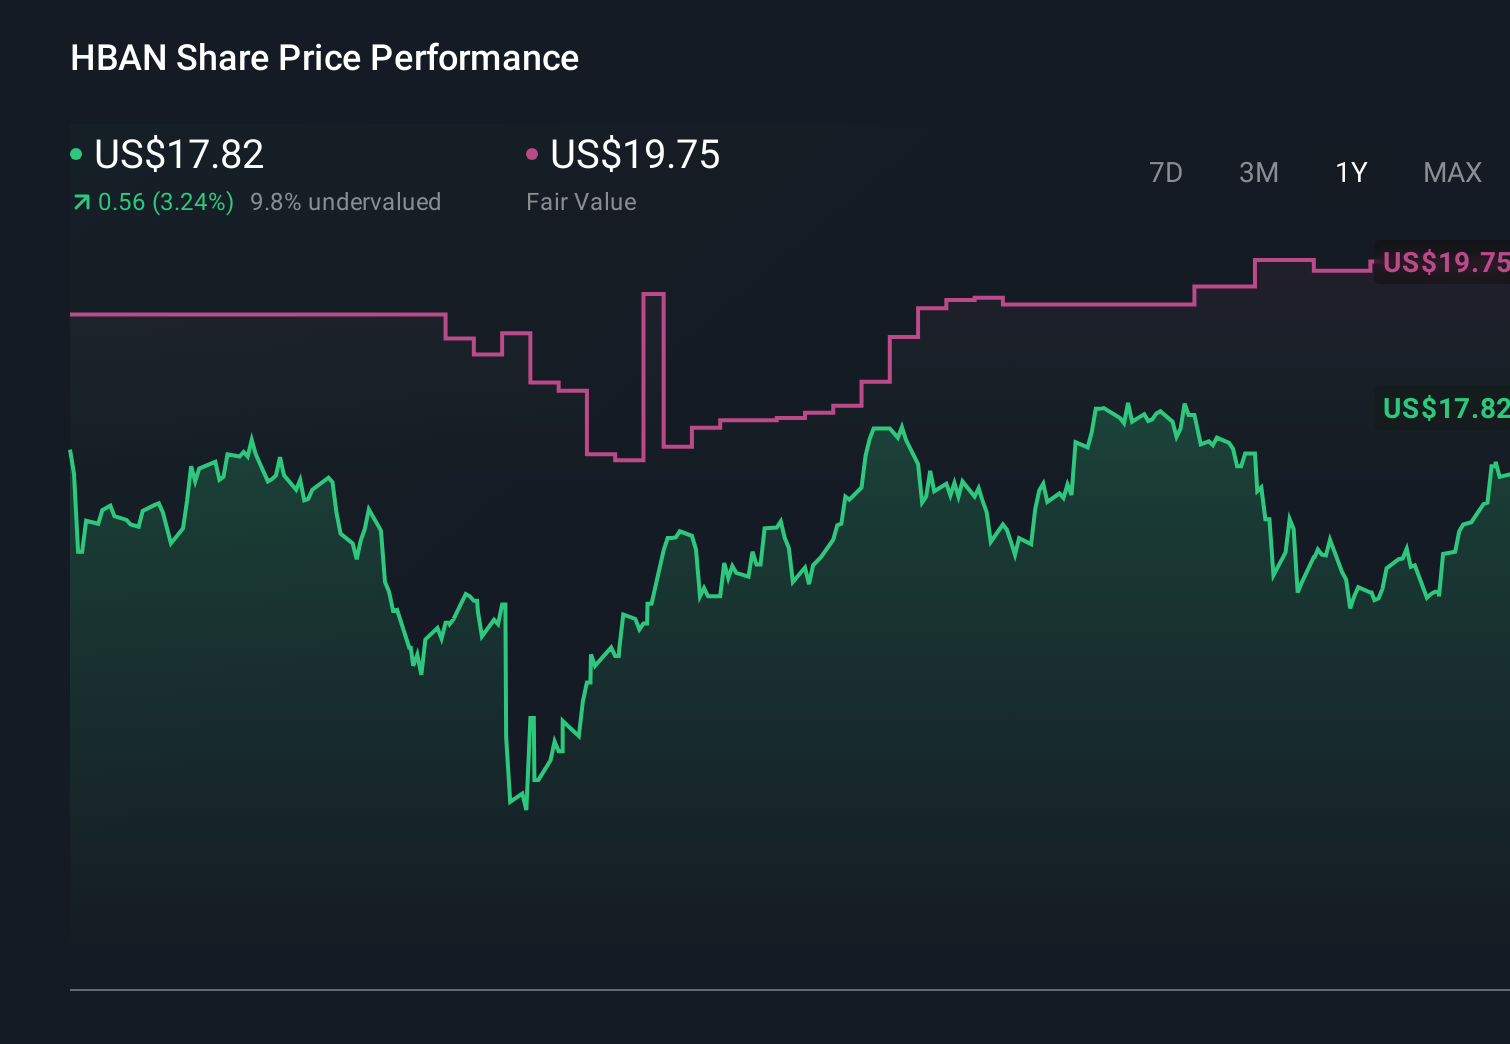
- After a solid run, the stock is up 15.6% over the last month and 15.9% over the past year, adding to a 79.4% gain over five years that has investors asking if it is getting ahead of itself.
- Recent headlines have focused on Huntington's continued push to grow its regional footprint and deepen customer relationships, alongside a broader sector narrative around interest rate expectations and credit quality. Together, these themes help explain why the market has been willing to rerate many regional banks, but also why sentiment can shift quickly.
- Right now, Huntington scores a 3/6 valuation check score, suggesting it looks undervalued on some metrics but not all. This is exactly what we will unpack using multiple valuation approaches, before finishing with a more holistic way to think about its worth beyond the numbers.
Find out why Huntington Bancshares's 15.9% return over the last year is lagging behind its peers.
Approach 1: Huntington Bancshares Excess Returns Analysis
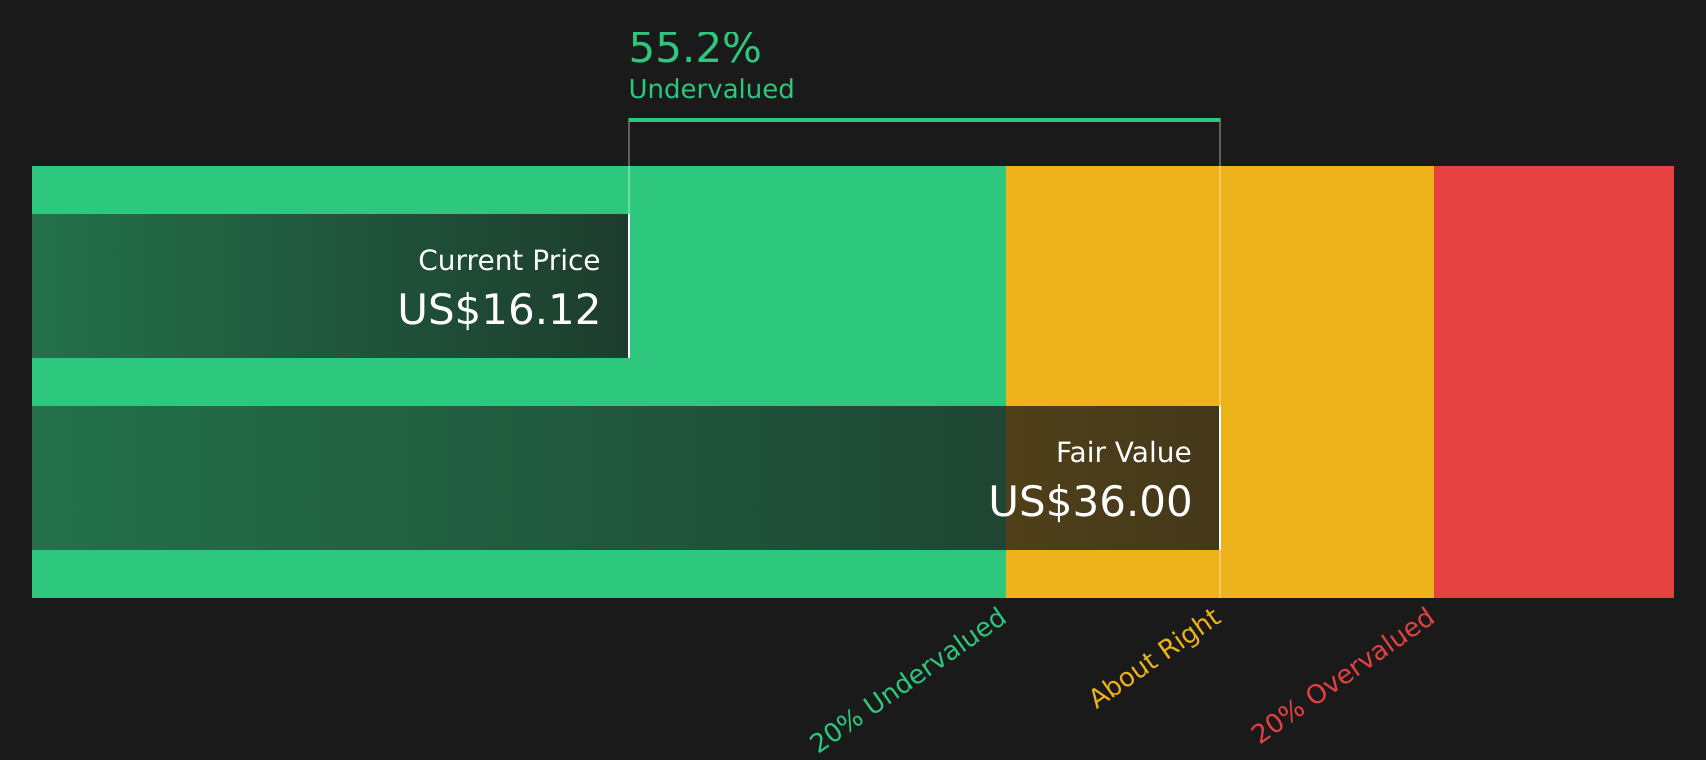
The Excess Returns model looks at how much profit Huntington Bancshares can generate above the return that investors require on its equity, then capitalizes those surplus profits into an intrinsic value per share.
In this framework, Huntington starts with a Book Value of $13.37 per share and a Stable EPS of $1.77 per share, based on weighted future Return on Equity estimates from 13 analysts. With an Average Return on Equity of 11.89% and a Stable Book Value forecast of $14.90 per share from 11 analysts, the bank is expected to keep earning returns on its capital that exceed its Cost of Equity of $1.08 per share.
The difference between what it earns and what investors demand is the Excess Return, estimated at $0.69 per share. When these excess returns are projected forward and discounted, the model arrives at an intrinsic value of about $32.01 per share. This suggests the stock is roughly 44.5% undervalued versus the current market price.
Result: UNDERVALUED
Our Excess Returns analysis suggests Huntington Bancshares is undervalued by 44.5%. Track this in your watchlist or portfolio, or discover 911 more undervalued stocks based on cash flows.
Approach 2: Huntington Bancshares Price vs Earnings
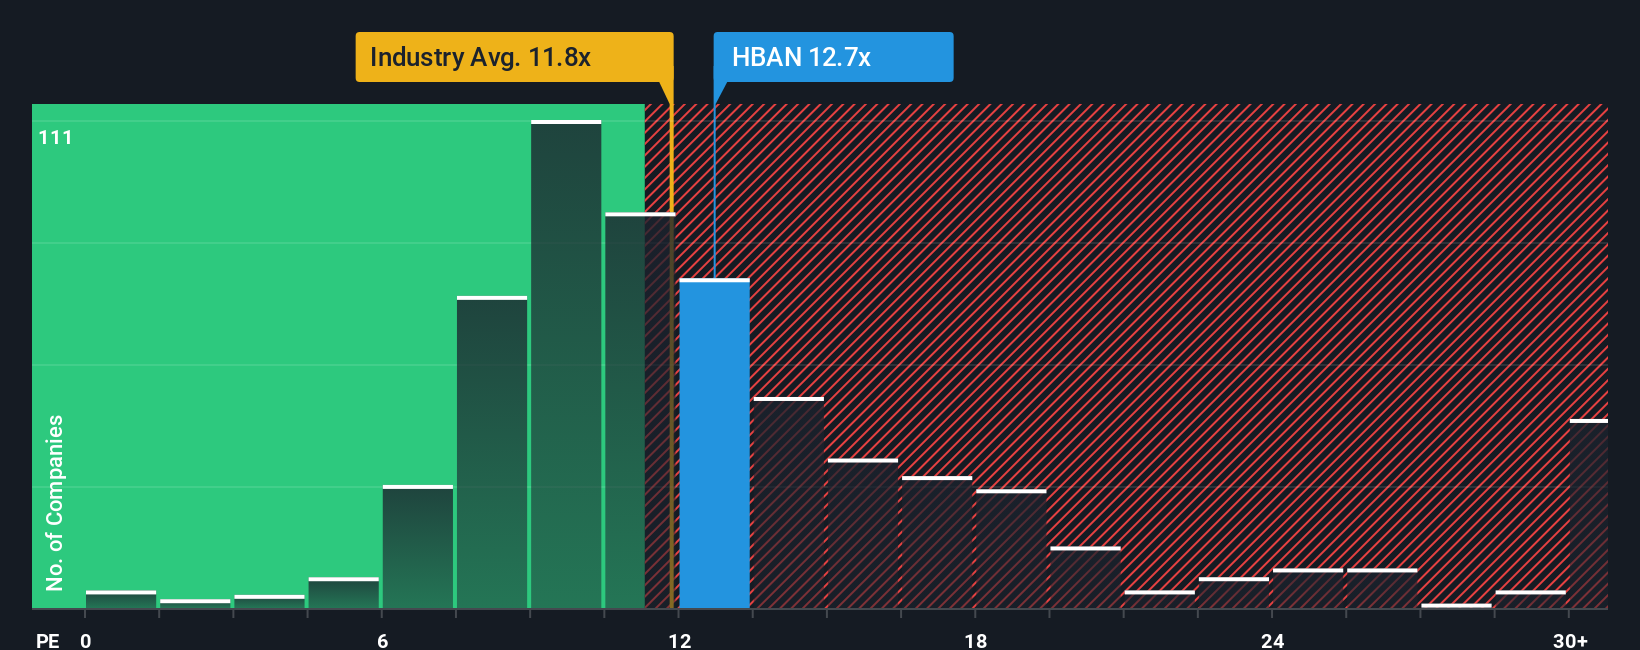
For a consistently profitable bank like Huntington Bancshares, the price to earnings (PE) ratio is a practical way to gauge whether investors are paying a reasonable price for each dollar of earnings. In general, companies with stronger growth prospects and lower perceived risk justify higher PE ratios, while slower growth or higher risk should translate into lower, more cautious multiples.
Huntington currently trades on a PE of around 13.2x, which is slightly above the Banks industry average of about 12.0x and almost in line with the peer group at roughly 13.1x. Simply Wall St also calculates a proprietary Fair Ratio of 19.7x for Huntington, which is the PE you might expect given its earnings growth profile, profitability, size, industry and specific risks. This Fair Ratio can be more informative than simple peer or industry comparisons because it explicitly incorporates those company specific drivers rather than assuming all banks deserve similar multiples.
Comparing Huntington’s current 13.2x PE to the 19.7x Fair Ratio suggests the market is still assigning a discount relative to what its fundamentals might warrant, indicating that the stock may be undervalued on this measure.
Result: UNDERVALUED
PE ratios tell one story, but what if the real opportunity lies elsewhere? Discover 1463 companies where insiders are betting big on explosive growth.
Upgrade Your Decision Making: Choose your Huntington Bancshares Narrative
Earlier we mentioned that there is an even better way to understand valuation, so let us introduce you to Narratives, a simple way to connect your view of Huntington Bancshares’ future with a set of numbers that flow through to a Fair Value estimate. A Narrative is your story about the company, turned into a structured forecast of revenue, earnings and margins, which then links directly to a Fair Value you can compare to today’s share price to decide whether to buy, hold or sell. On Simply Wall St’s Community page, millions of investors build and share these Narratives, which are updated dynamically as new information like earnings or acquisition news arrives. For Huntington, one investor might build an optimistic Narrative around rapid growth from the Cadence and Veritex expansions with high margins and a Fair Value above $21, while another could focus on integration, credit and regulatory risks, assume slower growth and tighter margins, and land closer to $15. The platform makes it easy to see which Narrative you believe and what that implies for your next move.
Do you think there's more to the story for Huntington Bancshares? Head over to our Community to see what others are saying!
This article by Simply Wall St is general in nature. We provide commentary based on historical data and analyst forecasts only using an unbiased methodology and our articles are not intended to be financial advice. It does not constitute a recommendation to buy or sell any stock, and does not take account of your objectives, or your financial situation. We aim to bring you long-term focused analysis driven by fundamental data. Note that our analysis may not factor in the latest price-sensitive company announcements or qualitative material. Simply Wall St has no position in any stocks mentioned.
Have feedback on this article? Concerned about the content? Get in touch with us directly. Alternatively, email editorial-team@simplywallst.com