
- PREMIUM
- LIVE QUOTES
- INSTITUTIONS
 Index Options
 State Street
 CME Group
 Nasdaq
 Cboe
Cboe TradingView
 Wall Street Journal
Is Trimble Still Attractively Priced After Its Push Into Connected Construction?
- Wondering if Trimble at around $78.89 is still a smart buy, or if the easy money has already been made? You are not alone. That is exactly what this breakdown is here to unpack.
- Despite a recent 5.3% pullback over the last week, the stock is still up 4.6% over the past month, 13.2% year to date and 61.9% over three years, a pattern that hints at both durable growth and shifting risk perceptions.
- Recent headlines have focused on Trimble's push deeper into connected construction and geospatial workflows, including expanded partnerships and product updates that strengthen its position in infrastructure and agriculture technology. At the same time, ongoing market interest in automation and digitalization has kept investor attention on companies like Trimble that sit at the intersection of hardware, software and data.
- On our framework, Trimble scores a 3/6 valuation score, meaning it screens as undervalued on half of the key checks. Next, we will walk through the main valuation approaches investors are using today, before finishing with a more intuitive way to think about what the stock is really worth in the long run.
Find out why Trimble's 11.5% return over the last year is lagging behind its peers.
Approach 1: Trimble Discounted Cash Flow (DCF) Analysis
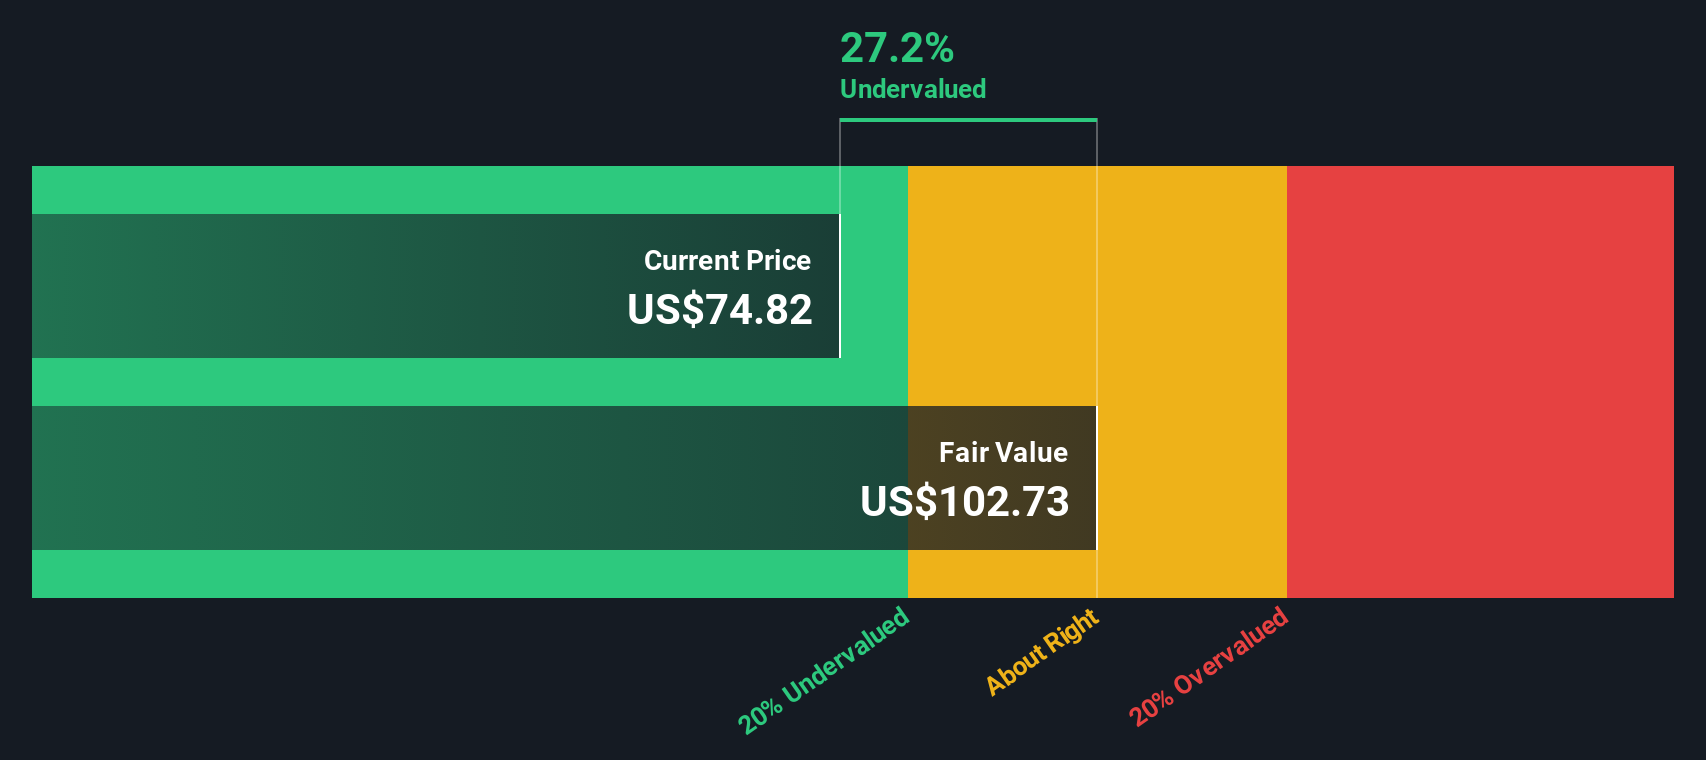
A Discounted Cash Flow model estimates what a company is worth by projecting its future cash flows and then discounting them back to today, to reflect risk and the time value of money. For Trimble, the model starts with last twelve month Free Cash Flow of about $307.6 Million and uses a 2 Stage Free Cash Flow to Equity approach, where near term cash flows are guided by analyst estimates and later years are extrapolated by Simply Wall St.
Under this framework, Trimble's Free Cash Flow is projected to rise to roughly $1.84 Billion by 2035, with milestones such as about $811 Million in 2026 and $1.01 Billion in 2027. Adding up all these discounted cash flows gives an estimated intrinsic value of $102.62 per share, in $ terms, compared to a current price around $78.89. That implies the shares trade at a 23.1% discount to the DCF estimate and suggests the market is still pricing Trimble below its long term cash generation potential.
Result: UNDERVALUED
Our Discounted Cash Flow (DCF) analysis suggests Trimble is undervalued by 23.1%. Track this in your watchlist or portfolio, or discover 911 more undervalued stocks based on cash flows.
Approach 2: Trimble Price vs Earnings
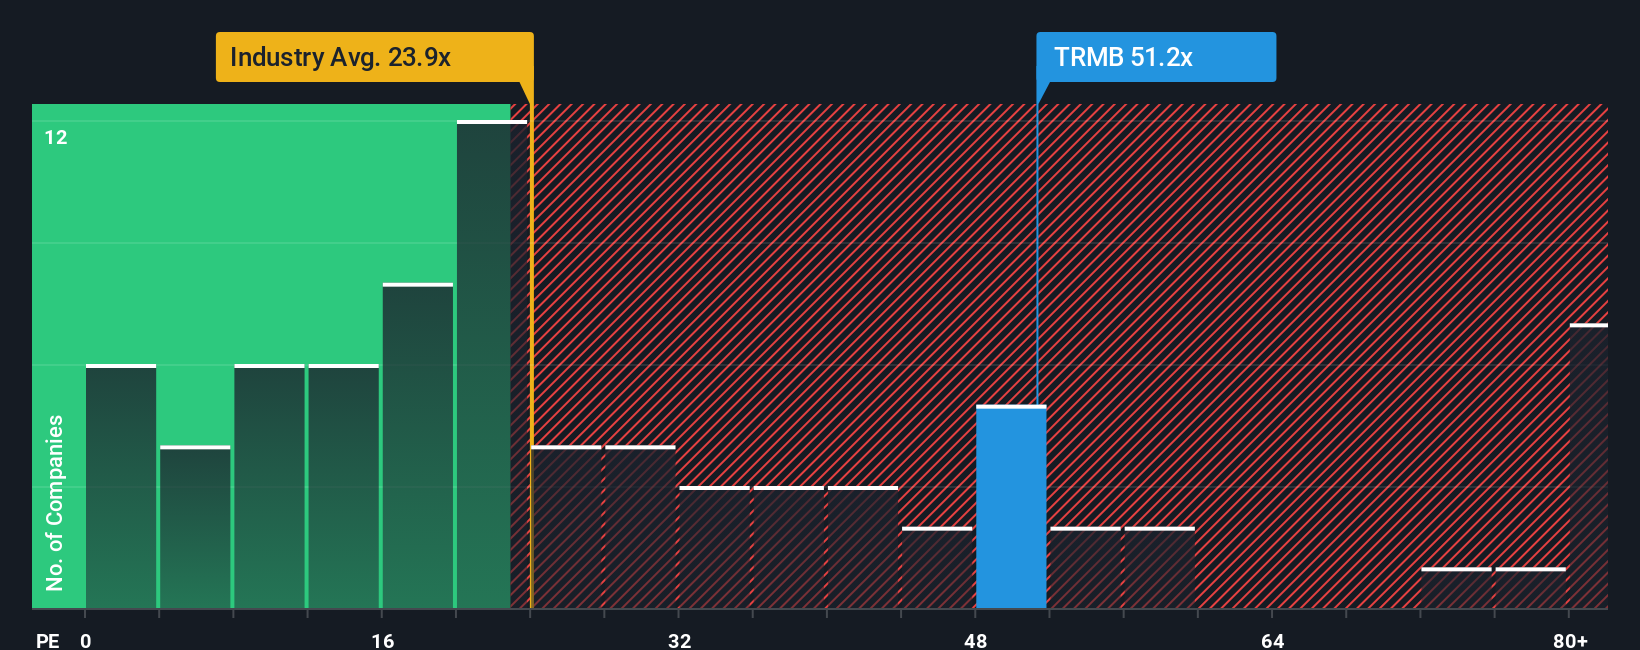
For profitable businesses like Trimble, the Price to Earnings, or PE, ratio is a useful way to gauge how much investors are willing to pay today for each dollar of current earnings. In general, companies with stronger, more reliable growth and lower perceived risk deserve a higher, or more expensive, PE, while slower growing or riskier firms typically trade on lower multiples.
Trimble currently trades on a PE of about 52.5x, which is well above both the broader electronic industry average of roughly 24.3x and the peer group average of around 36.5x. At first glance, that premium suggests the market is pricing in materially better growth and resilience than the typical industry name.
Simply Wall St’s Fair Ratio framework refines this view by estimating what PE a company should trade on, given its specific mix of earnings growth, industry, profit margins, market cap and risk profile. For Trimble, this Fair Ratio is around 32.3x. This implies that, once these fundamentals are accounted for, the current 52.5x still looks rich rather than merely strong. On this multiple based lens, Trimble screens as overvalued.
Result: OVERVALUED
PE ratios tell one story, but what if the real opportunity lies elsewhere? Discover 1463 companies where insiders are betting big on explosive growth.
Upgrade Your Decision Making: Choose your Trimble Narrative
Earlier we mentioned that there is an even better way to understand valuation, so let us introduce you to Narratives, a simple way to attach your story about Trimble to the numbers by linking your assumptions for future revenue, earnings and margins to a concrete forecast and Fair Value estimate, then comparing that Fair Value to today’s price to inform your investment decisions.
On Simply Wall St’s Community page, millions of investors use Narratives as an easy, accessible tool. Each Narrative captures a view of the business, translates it into a financial model and Fair Value, and then updates dynamically as new information like earnings, product announcements or macro news comes in, so your Trimble view stays current without you rebuilding everything from scratch.
For example, one optimistic Trimble Narrative might focus on the software shift, recurring revenue goals and AI products to support a Fair Value closer to the most bullish analyst target of about $100 per share. A more cautious Narrative could emphasize macro risks and execution challenges and arrive nearer the lowest target of roughly $84. This can give you a clear, numbers-backed way to see which story you find more reasonable and how that relates to today’s share price.
Do you think there's more to the story for Trimble? Head over to our Community to see what others are saying!

This article by Simply Wall St is general in nature. We provide commentary based on historical data and analyst forecasts only using an unbiased methodology and our articles are not intended to be financial advice. It does not constitute a recommendation to buy or sell any stock, and does not take account of your objectives, or your financial situation. We aim to bring you long-term focused analysis driven by fundamental data. Note that our analysis may not factor in the latest price-sensitive company announcements or qualitative material. Simply Wall St has no position in any stocks mentioned.
Have feedback on this article? Concerned about the content? Get in touch with us directly. Alternatively, email editorial-team@simplywallst.com