
- PREMIUM
- LIVE QUOTES
- INSTITUTIONS
 Index Options
 State Street
 CME Group
 Nasdaq
 Cboe
Cboe TradingView
 Wall Street Journal
Has Ormat Technologies Recent 57.4% Surge in 2025 Already Priced In Its Growth Story
- Wondering if Ormat Technologies is still a smart buy after its big run, or if the easy money has already been made? You are not alone, and that is exactly what we are going to unpack here.
- Despite a soft patch in the last week with the stock down 3.8%, Ormat is still up 1.1% over the past month and 57.4% year to date, translating to a 62.9% gain over the last year.
- That surge has come as investors have doubled down on clean energy names like Ormat, which develops and operates geothermal and renewable power projects. This has positioned it as a potential long term winner as utilities decarbonize. At the same time, shifting sentiment around interest rates and infrastructure spending has added extra momentum, as capital has rotated back into regulated and contracted cash flow businesses.
- Yet on our checks, Ormat scores just 0/6 on valuation, suggesting the market may be paying up for that growth story. Next, we will break down what different valuation methods say about the stock today, and then finish with a more holistic way to judge whether the current price really makes sense.
Ormat Technologies scores just 0/6 on our valuation checks. See what other red flags we found in the full valuation breakdown.
Approach 1: Ormat Technologies Discounted Cash Flow (DCF) Analysis
A Discounted Cash Flow, or DCF, model estimates what a business is worth today by projecting its future cash flows and discounting them back to the present. For Ormat Technologies, this approach uses a 2 stage Free Cash Flow to Equity model based on cash flow projections in $.
Ormat currently has last twelve month free cash flow of about $235 million, and analysts expect this to grow steadily over time. By 2027, free cash flow is projected to reach roughly $9.7 million, with further growth extrapolated by Simply Wall St out to 2035 as the company expands its geothermal and renewable power operations.
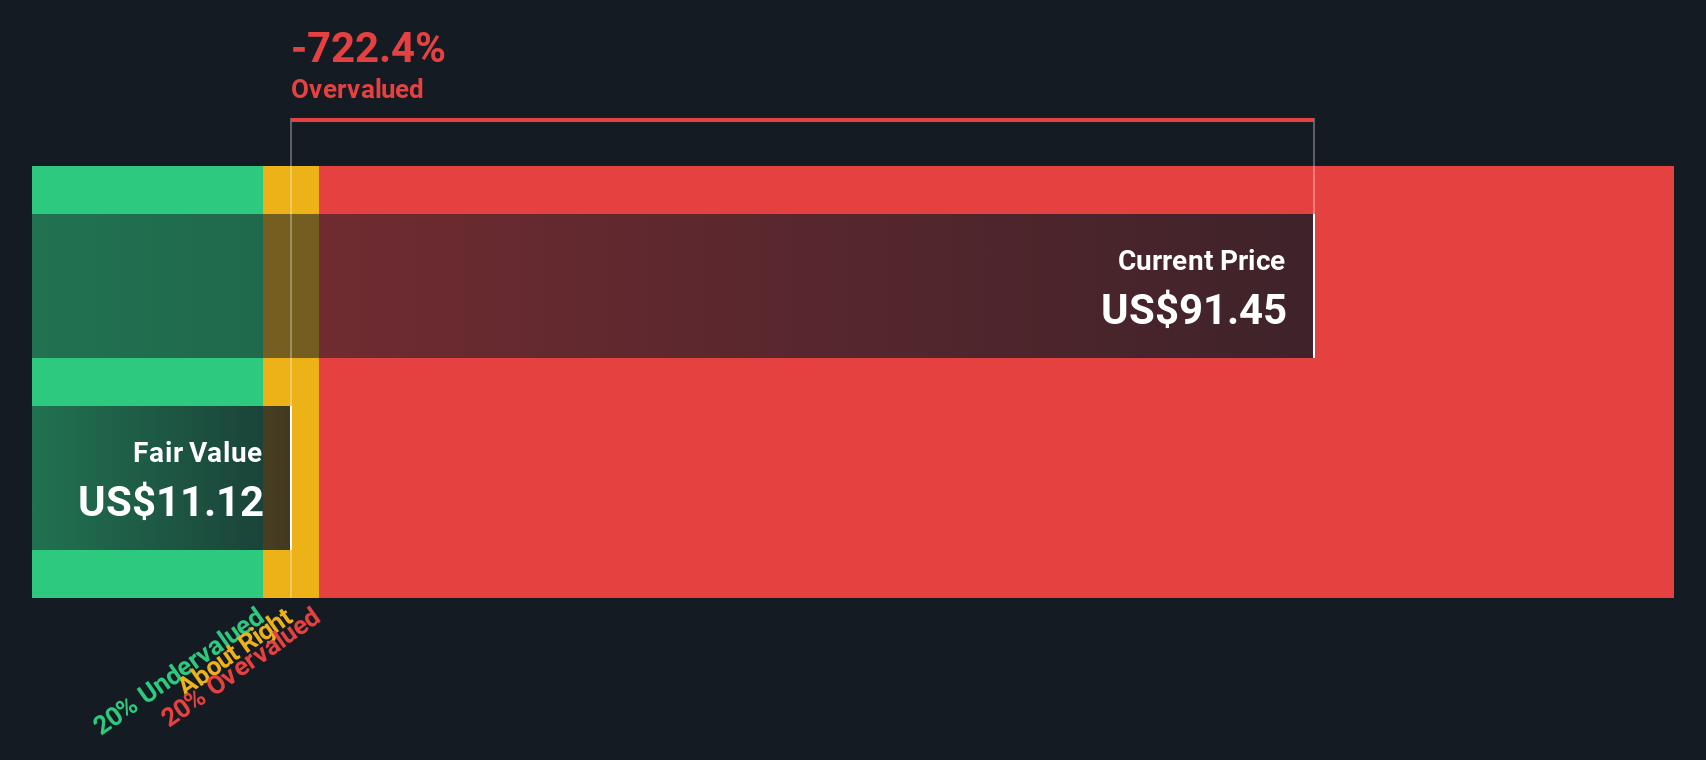
Aggregating and discounting these projected cash flows results in an estimated intrinsic value of about $24 per share. Compared with the current market price, the model implies Ormat is around 353.6% overvalued, suggesting expectations embedded in the stock have moved far ahead of the underlying cash flow outlook.
Result: OVERVALUED
Our Discounted Cash Flow (DCF) analysis suggests Ormat Technologies may be overvalued by 353.6%. Discover 911 undervalued stocks or create your own screener to find better value opportunities.
Approach 2: Ormat Technologies Price vs Earnings
For a consistently profitable company like Ormat Technologies, the price to earnings (PE) ratio is a useful way to gauge how much investors are paying for each dollar of current earnings. In general, faster growing, lower risk businesses tend to justify higher PE multiples, while slower growth or higher uncertainty usually means a lower, more conservative PE is appropriate.
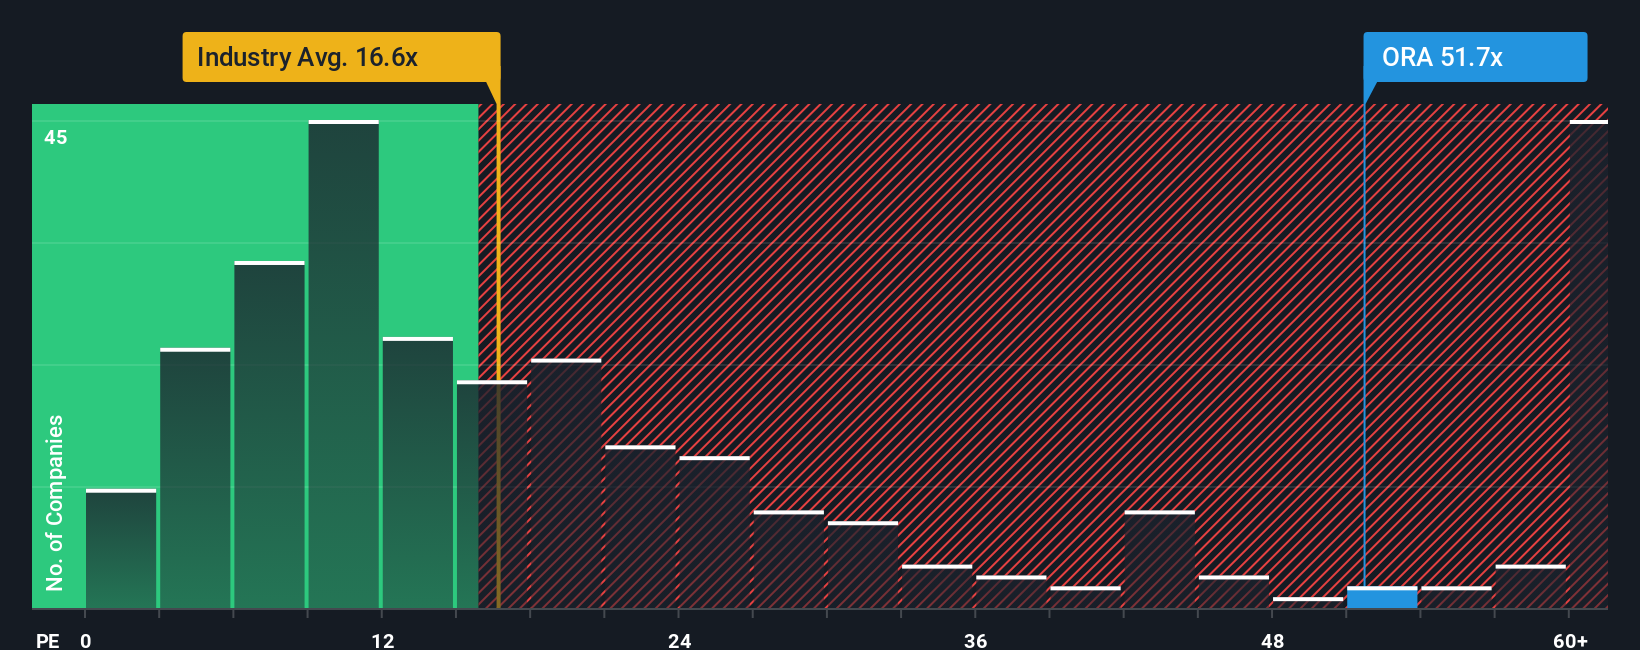
Ormat currently trades on a PE of about 49.6x, which is roughly three times the Renewable Energy industry average of 16.6x and well above the peer group average of around 16.3x. On the surface, that suggests the market is placing a hefty premium on Ormat’s earnings compared to its sector.
Simply Wall St’s Fair Ratio framework goes a step further by estimating what PE multiple would make sense given Ormat’s specific growth outlook, profit margins, risk profile, industry and market cap. For Ormat, that Fair Ratio comes out at about 22.3x, which is significantly below the current 49.6x. Since this stock specific fair multiple bakes in growth and risk, it is a more reliable yardstick than simple peer or industry comparisons and implies the shares are trading well above what those fundamentals support today.
Result: OVERVALUED
PE ratios tell one story, but what if the real opportunity lies elsewhere? Discover 1463 companies where insiders are betting big on explosive growth.
Upgrade Your Decision Making: Choose your Ormat Technologies Narrative
Earlier we mentioned that there is an even better way to understand valuation, so let us introduce you to Narratives, a simple framework that lets you attach a clear story and set of assumptions to your view on a company, from its future revenues, earnings and margins through to what you believe is a fair value per share.
A Narrative connects three things in one place: the business story you believe, the financial forecast that flows from that story, and the fair value you get when you discount those future cash flows back to today.
On Simply Wall St, Narratives are easy to use and live inside the Community page, where millions of investors can define their assumptions and then instantly compare their Fair Value to the current share price to decide whether a stock looks like a buy, hold or sell.
Because Narratives update dynamically when news, earnings or guidance changes, your fair value view automatically stays aligned with the latest information rather than a static model you built months ago.
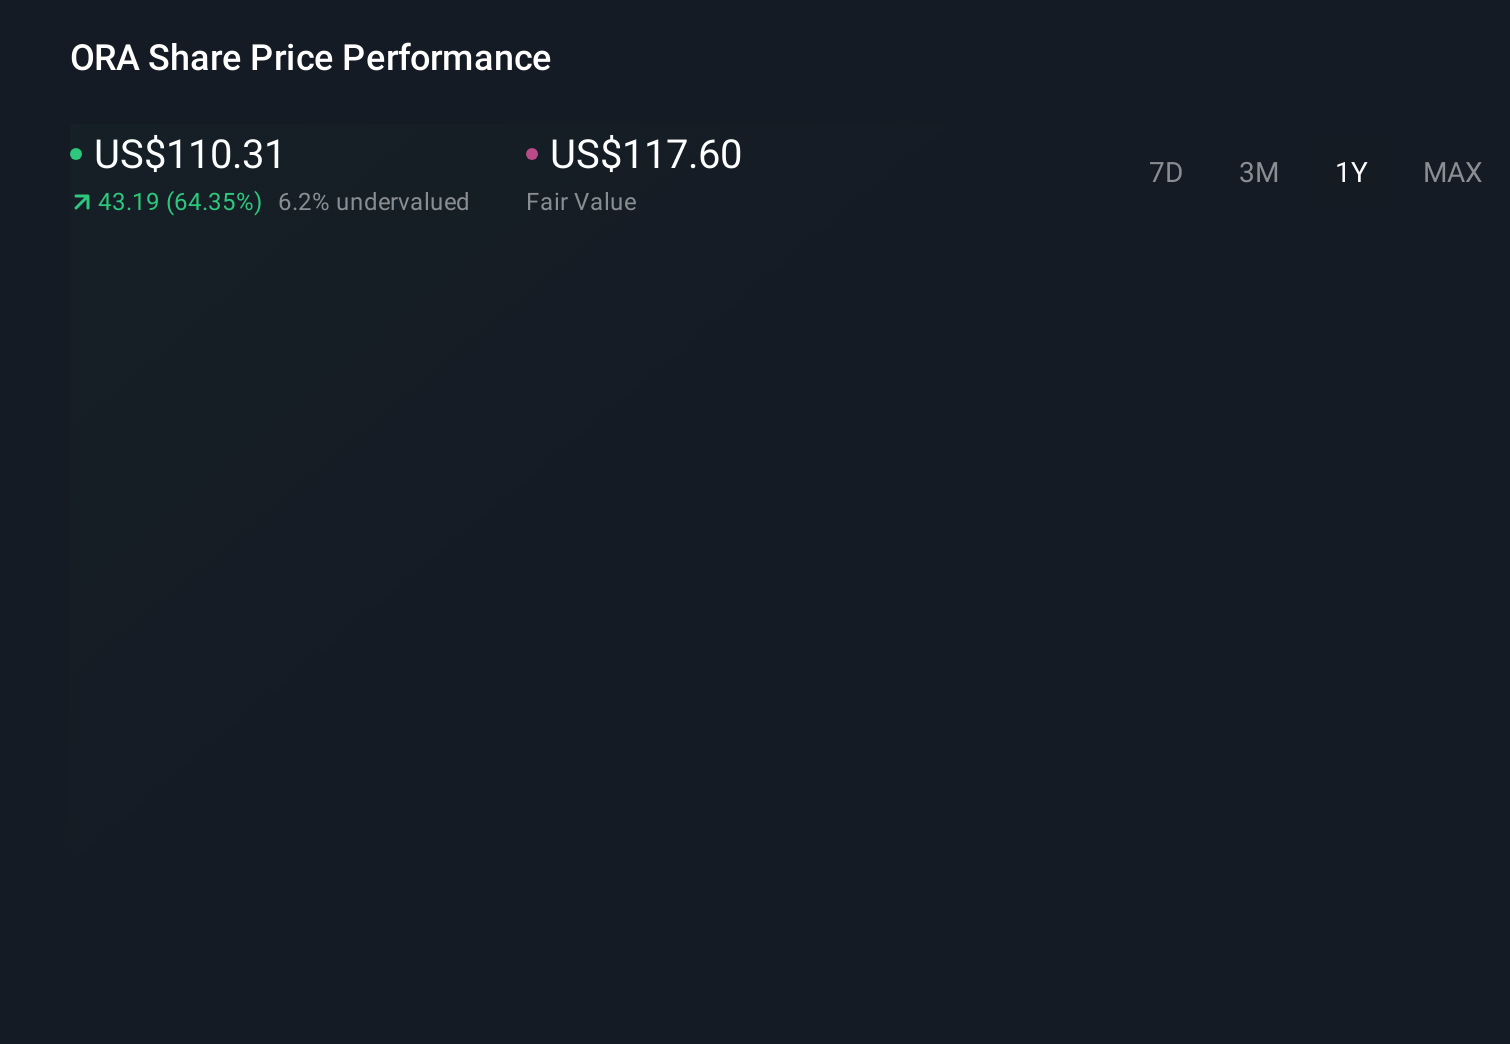
For Ormat Technologies, one Narrative might lean bullish and conclude that stronger policy support and geothermal expansion justify a fair value near 117.60 dollars. A more cautious Narrative might instead focus on battery supply, capex and policy risk to justify a fair value closer to 85 dollars.
Do you think there's more to the story for Ormat Technologies? Head over to our Community to see what others are saying!
This article by Simply Wall St is general in nature. We provide commentary based on historical data and analyst forecasts only using an unbiased methodology and our articles are not intended to be financial advice. It does not constitute a recommendation to buy or sell any stock, and does not take account of your objectives, or your financial situation. We aim to bring you long-term focused analysis driven by fundamental data. Note that our analysis may not factor in the latest price-sensitive company announcements or qualitative material. Simply Wall St has no position in any stocks mentioned.
Have feedback on this article? Concerned about the content? Get in touch with us directly. Alternatively, email editorial-team@simplywallst.com