
- PREMIUM
- LIVE QUOTES
- INSTITUTIONS
 Index Options
 State Street
 CME Group
 Nasdaq
 Cboe
Cboe TradingView
 Wall Street Journal
Has Travelers Stock Run Too Far After Its Strong Multi Year Rally?
- Wondering if Travelers Companies is still a smart buy after its big run, or if you would be overpaying at today’s levels? This breakdown will help you put a number on what the stock might really be worth.
- The share price recently closed around $291.27, after climbing 4.6% over the last week, 2.4% over the past month, and delivering a strong 25.4% gain over the last year that builds on a 62.8% three year and 133.4% five year run.
- Behind those moves, investors have been digesting a steady stream of insurance sector updates, from shifting catastrophe risk expectations to evolving pricing trends in commercial and personal lines. For Travelers specifically, recent commentary around disciplined underwriting, exposure management, and capital returns has reinforced the idea that it could be a relative winner in a tougher insurance landscape.
- Right now, Travelers scores a 5/6 valuation check, suggesting the market may still be underestimating parts of the story. Next we will walk through the standard valuation approaches before finishing with a more powerful way to think about what “fair value” really means for this stock.
Approach 1: Travelers Companies Excess Returns Analysis
The Excess Returns model looks at how efficiently Travelers Companies turns shareholder capital into profits, then compares those returns to the minimum return investors require. In simple terms, it asks how much value the company can create above its cost of equity and projects that into the future.
Travelers starts with a solid foundation, with Book Value of $141.74 per share and an Average Return on Equity of 17.04%. That level of profitability supports a Stable EPS estimate of $28.28 per share, based on forward looking analyst expectations. Against a Cost of Equity of $11.54 per share, the company is expected to generate an Excess Return of $16.74 per share, suggesting meaningful value creation on each dollar of equity deployed. Over time, this compounds into a higher Stable Book Value of $165.92 per share as the balance sheet grows.
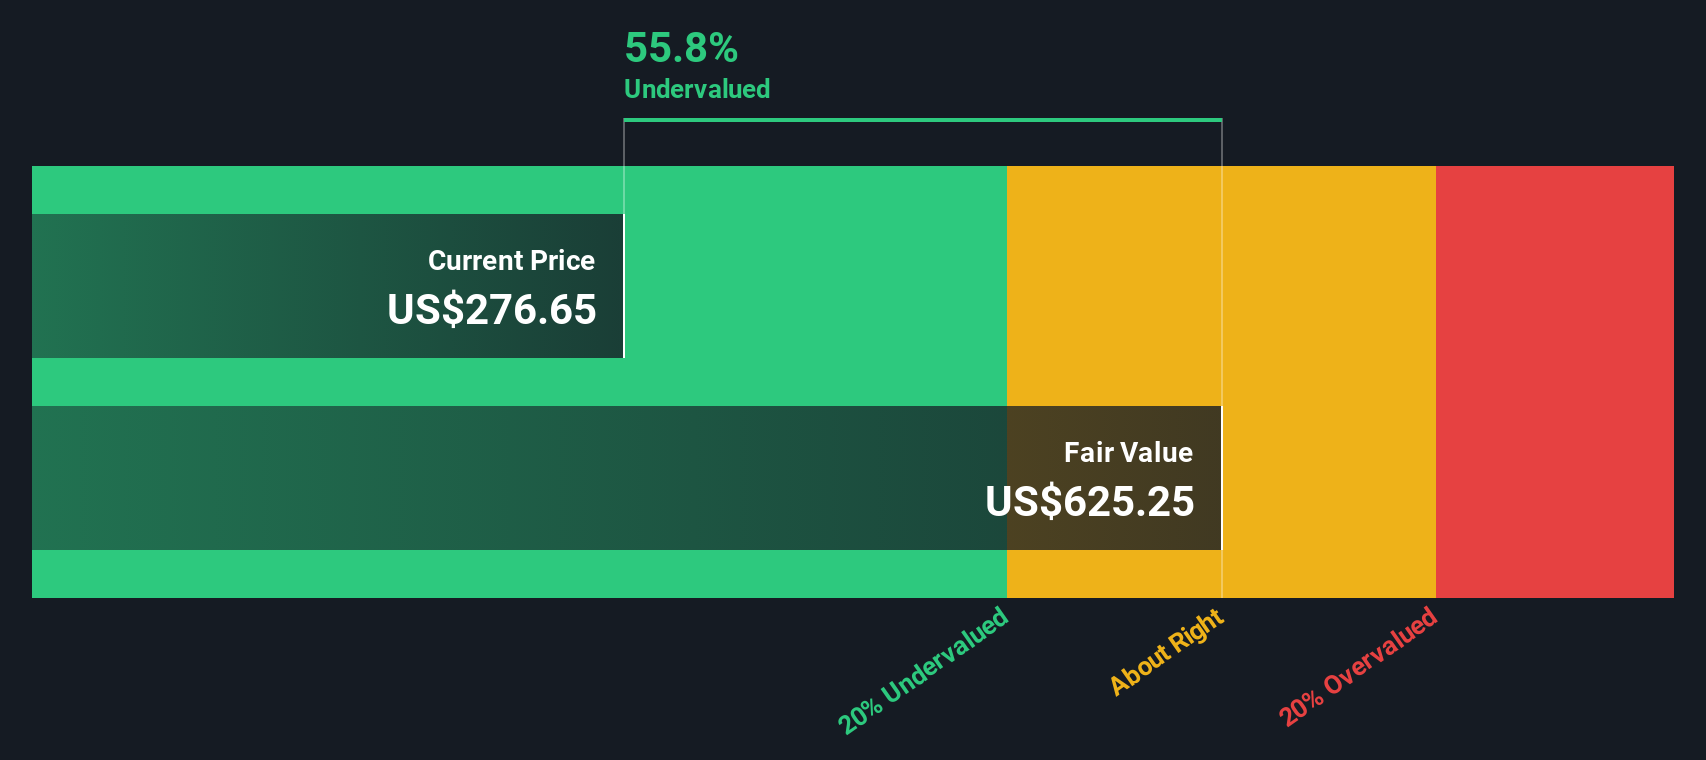
Feeding these inputs into the Excess Returns framework produces an intrinsic value estimate of about $618.75 per share, implying the stock is roughly 52.9% undervalued versus the recent price near $291.27.
Result: UNDERVALUED
Our Excess Returns analysis suggests Travelers Companies is undervalued by 52.9%. Track this in your watchlist or portfolio, or discover 912 more undervalued stocks based on cash flows.
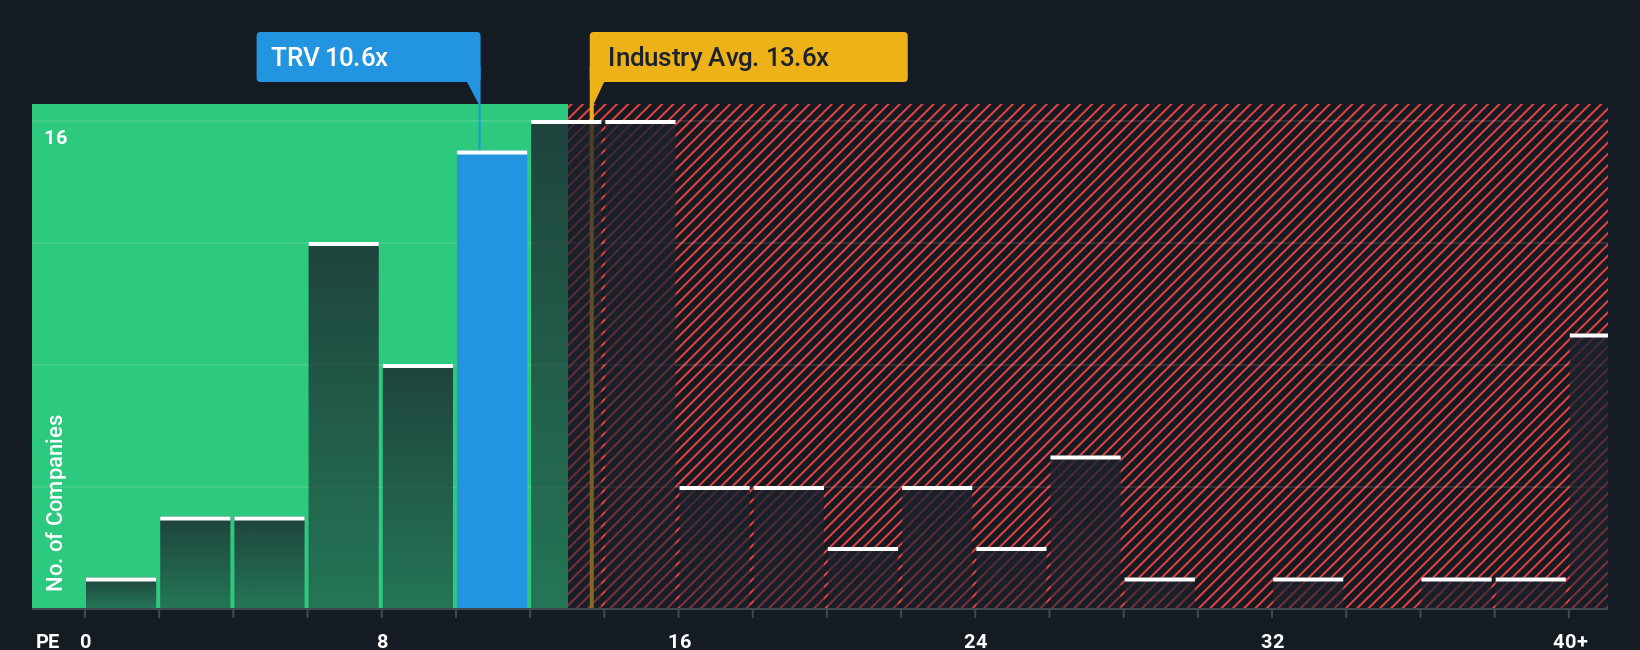
Approach 2: Travelers Companies Price vs Earnings
For a mature, consistently profitable insurer like Travelers, the price to earnings ratio is a practical way to gauge value because it connects what you pay for each share directly to the profits the business is generating today. In general, faster growth and lower perceived risk justify a higher PE multiple, while slower growth or elevated risk argue for a lower one, so the key question is what range looks “normal” for this type of company.
Travelers currently trades on a PE of about 11.14x, which sits slightly below the broader Insurance industry average of roughly 13.41x and close to the peer group average near 11.31x. Simply Wall St goes a step further with its Fair Ratio, an estimate of what PE you would expect for Travelers given its specific earnings growth profile, margins, risk factors, industry positioning and market cap. Because this metric is tailored to the company, it is more informative than a simple comparison with peers or the sector, which can mask important differences in quality and risk.
For Travelers, the Fair Ratio comes out at around 12.23x, modestly above the current 11.14x. This suggests the shares still look undervalued on this earnings based lens.
Result: UNDERVALUED
PE ratios tell one story, but what if the real opportunity lies elsewhere? Discover 1462 companies where insiders are betting big on explosive growth.
Upgrade Your Decision Making: Choose your Travelers Companies Narrative
Earlier we mentioned that there is an even better way to understand valuation, so let us introduce you to Narratives. These are simple, story driven forecasts you can build on Simply Wall St’s Community page that connect your view of Travelers Companies’ future revenues, earnings and margins to a fair value estimate. They then constantly update that fair value as new information like earnings or news arrives, allowing you to compare it against the current share price to decide whether to buy, hold or sell. You can also see how other investors’ perspectives differ. For example, one Narrative might assume that underwriting strength, secular demand for specialty lines and ongoing buybacks justify a fair value near the most bullish analyst target of about $320 per share. A more cautious Narrative, focused on weather volatility, competitive pressure and regulatory risks, might instead anchor closer to the most conservative target of roughly $233 per share.
Do you think there's more to the story for Travelers Companies? Head over to our Community to see what others are saying!

This article by Simply Wall St is general in nature. We provide commentary based on historical data and analyst forecasts only using an unbiased methodology and our articles are not intended to be financial advice. It does not constitute a recommendation to buy or sell any stock, and does not take account of your objectives, or your financial situation. We aim to bring you long-term focused analysis driven by fundamental data. Note that our analysis may not factor in the latest price-sensitive company announcements or qualitative material. Simply Wall St has no position in any stocks mentioned.
Have feedback on this article? Concerned about the content? Get in touch with us directly. Alternatively, email editorial-team@simplywallst.com