
- PREMIUM
- LIVE QUOTES
- INSTITUTIONS
 Index Options
 State Street
 CME Group
 Nasdaq
 Cboe
Cboe TradingView
 Wall Street Journal
Has the 90% Rally Left fuboTV’s Sports Streaming Story Mispriced in 2025?
- Wondering if fuboTV at around $2.68 is a beaten down streamer with real upside or a value trap in disguise? This breakdown will walk you through what the numbers actually say about its valuation.
- The stock has pulled back sharply in the short term, down about 6.9% over the last week and 25.8% over the last month, but it is still up 90.1% year to date and 82.3% over the past year after a brutal 95.7% slide across five years.
- Recent attention has focused on fuboTV doubling down on live sports streaming, securing more sports centric content partnerships and expanding distribution on connected TV platforms. All of these developments tap into a growing cord cutting audience. At the same time, debate around rising sports rights costs, competitive pressure from bigger platforms and the path to sustainable profitability has fueled both optimism and caution in the share price.
- On our framework the stock scores a 5 out of 6 valuation score, suggesting it screens as undervalued on most checks. Next we will unpack how different valuation methods arrive at that view, before finishing with a more intuitive way to think about what fuboTV might really be worth.
Approach 1: fuboTV Discounted Cash Flow (DCF) Analysis
A Discounted Cash Flow model estimates what a business is worth today by projecting the cash it could generate in the future and then discounting those cash flows back to their value in the present.
For fuboTV, the model starts with last twelve months Free Cash Flow of about $122.4 Million, but expects a dip to roughly negative $105.0 Million in 2024 as the company continues investing in growth. From there, Simply Wall St extrapolates analyst expectations and projects a sharp recovery, with Free Cash Flow rising to around $1.21 Billion by 2035, still expressed in today’s dollars after discounting.
Using a 2 Stage Free Cash Flow to Equity model, these projected cash flows translate into an estimated intrinsic value of about $11.63 per share. Compared with the recent share price near $2.68, the DCF suggests the stock is roughly 76.9% undervalued. This indicates that the market is heavily discounting fuboTV’s long term cash generation potential.
Result: UNDERVALUED
Our Discounted Cash Flow (DCF) analysis suggests fuboTV is undervalued by 76.9%. Track this in your watchlist or portfolio, or discover 910 more undervalued stocks based on cash flows.
Approach 2: fuboTV Price vs Earnings
For companies that are generating earnings, the price to earnings ratio is often the cleanest way to gauge what investors are willing to pay for each dollar of profit. It helps translate expectations about future growth and risk into a single, comparable number across many different businesses.
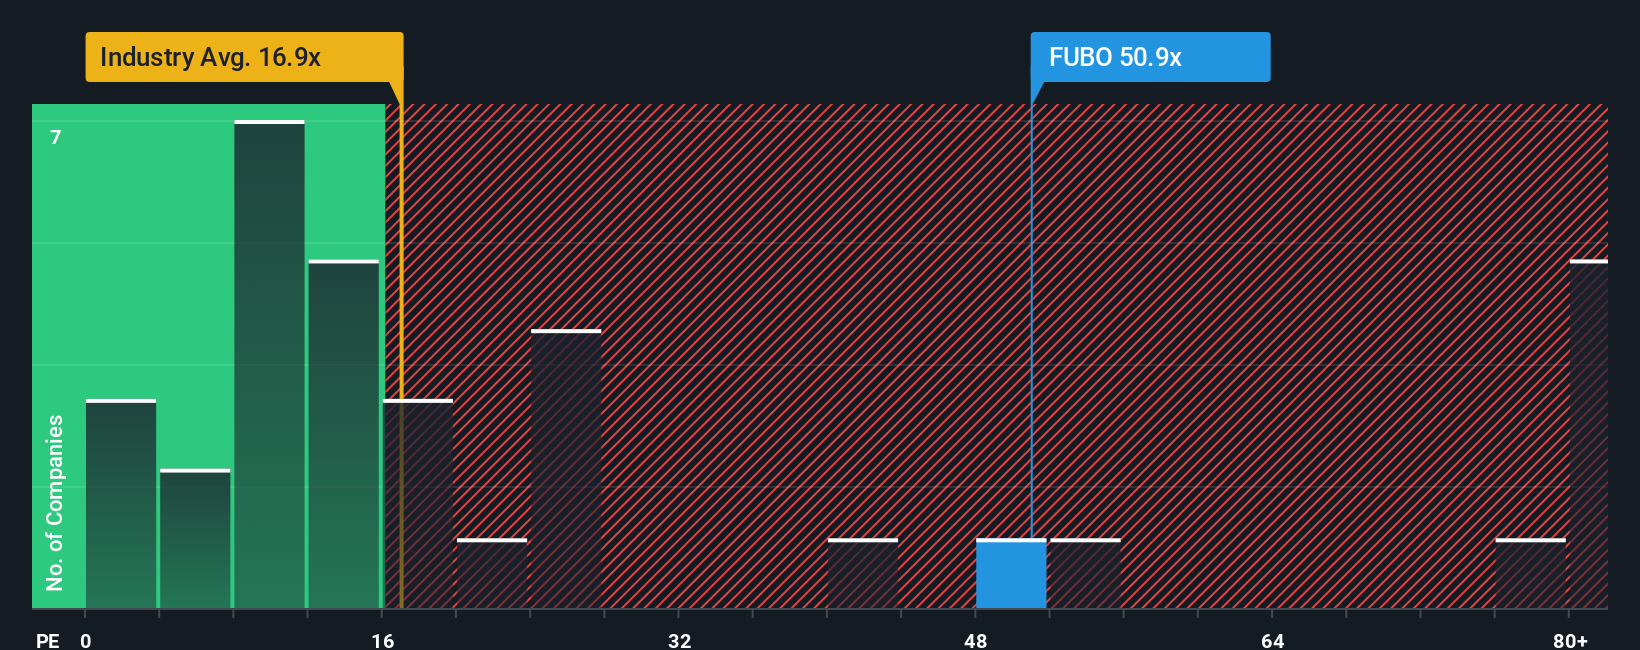
In general, faster growing and more stable companies can justify a higher PE ratio, while slower growing or riskier names tend to deserve a lower one. fuboTV currently trades on a PE of about 7.46x, which sits well below the Interactive Media and Services industry average of roughly 16.57x and also below the peer group average of around 12.61x. On these simple comparisons alone, the stock looks inexpensive relative to its sector.
Simply Wall St also applies a proprietary Fair Ratio framework, which estimates what a more tailored PE should be once factors like earnings growth potential, business risks, profit margins, industry dynamics and market cap are all taken into account. This is more informative than just lining fuboTV up against broad industry or peer averages because it adjusts for the company’s specific profile rather than assuming a one size fits all benchmark. In this case, the Fair Ratio still sits meaningfully higher than the current 7.46x PE, pointing to material upside from today’s valuation.
Result: UNDERVALUED
PE ratios tell one story, but what if the real opportunity lies elsewhere? Discover 1463 companies where insiders are betting big on explosive growth.
Upgrade Your Decision Making: Choose Your fuboTV Narrative
Earlier we mentioned that there is an even better way to understand valuation, so let us introduce you to Narratives, a simple way to attach your own story about a company to the numbers behind its fair value, including your assumptions for future revenue, earnings and margins.
A Narrative links three key pieces together: what you believe about the business, how that belief flows through a financial forecast, and the fair value that falls out the other side. This helps you see in one place why a stock might appear cheap or expensive under your specific view of the future.
On Simply Wall St, Narratives live in the Community page. Millions of investors use them as an easy and accessible tool to track their thesis, compare their Fair Value estimate with the current share price to consider whether to buy, hold or sell, and then watch that view update dynamically as fresh news, earnings and other data come in.
For example, one fuboTV Narrative might lean on sports-focused bundles, improved ad technology and margin gains to support a fair value near the more bullish 5.00 analyst target. A more cautious Narrative might instead focus on subscriber losses, content deal risk and cash burn, resulting in a fair value closer to the 4.25 bearish target.
Do you think there's more to the story for fuboTV? Head over to our Community to see what others are saying!
This article by Simply Wall St is general in nature. We provide commentary based on historical data and analyst forecasts only using an unbiased methodology and our articles are not intended to be financial advice. It does not constitute a recommendation to buy or sell any stock, and does not take account of your objectives, or your financial situation. We aim to bring you long-term focused analysis driven by fundamental data. Note that our analysis may not factor in the latest price-sensitive company announcements or qualitative material. Simply Wall St has no position in any stocks mentioned.
Have feedback on this article? Concerned about the content? Get in touch with us directly. Alternatively, email editorial-team@simplywallst.com