
- PREMIUM
- LIVE QUOTES
- INSTITUTIONS
 Index Options
 State Street
 CME Group
 Nasdaq
 Cboe
Cboe TradingView
 Wall Street Journal
How Enterprise Products Partners Valuation Stacks Up After Recent Energy Demand Recalibration
- If you have ever wondered whether Enterprise Products Partners is still a smart buy at today’s price, you are not alone. This breakdown is designed to give you a clear, valuation focused answer.
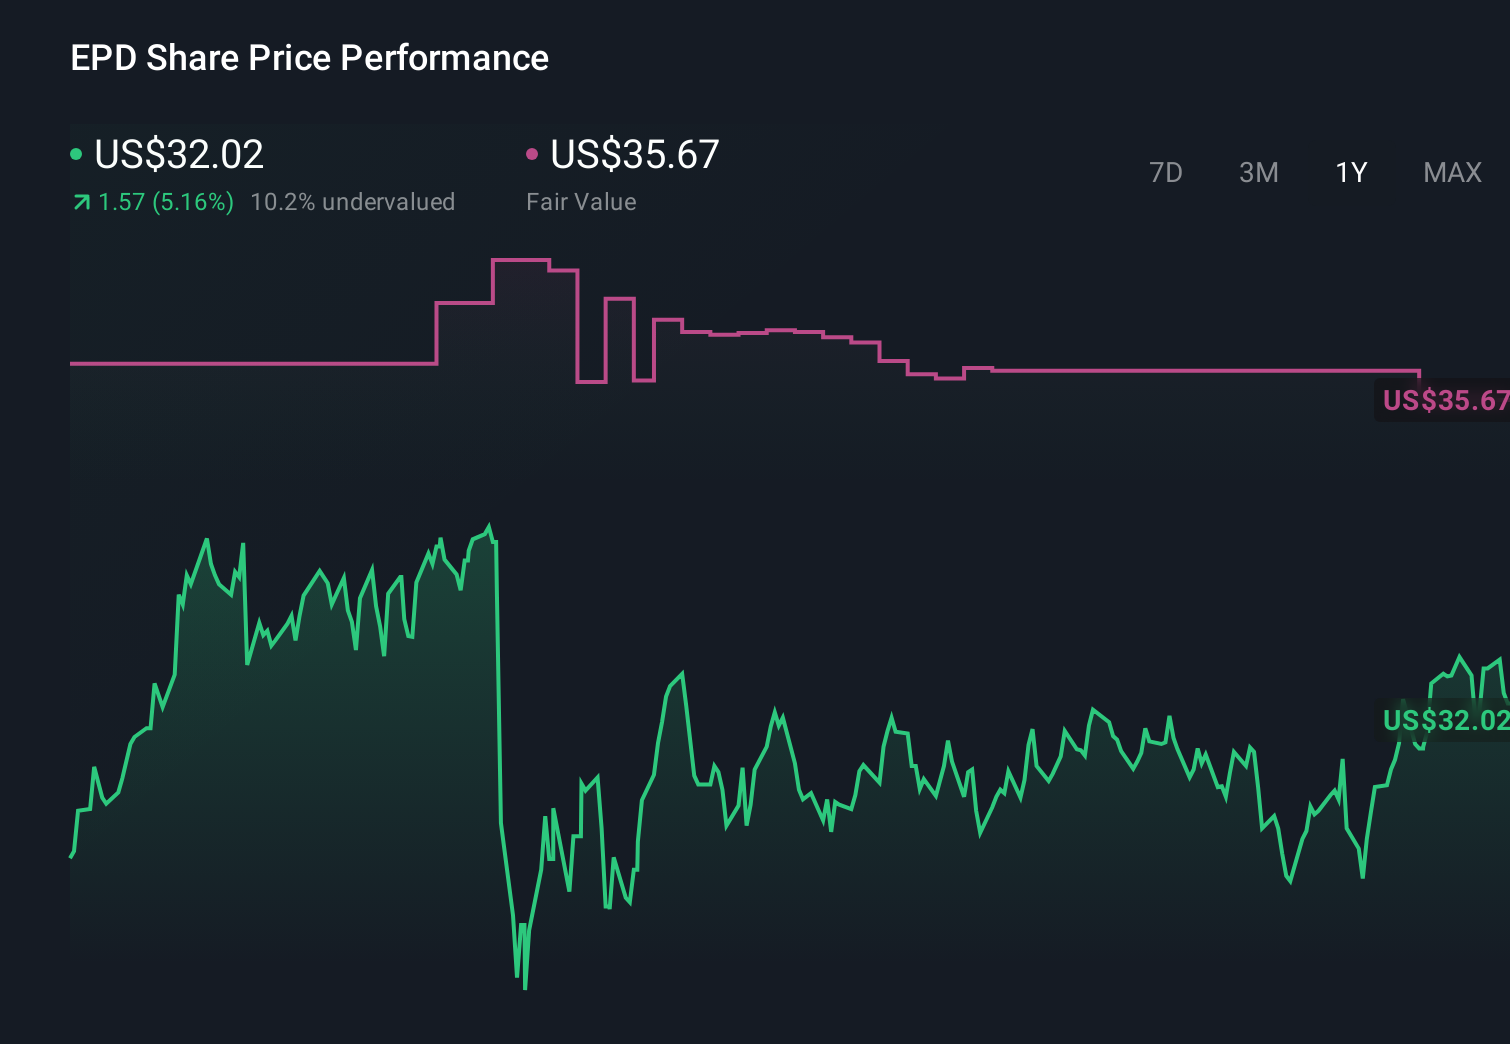
- Despite a modest pullback of around 1.7% over the last week and 1.5% over the last month, Enterprise is still up about 8.7% over the past year and 128.0% over five years. This indicates that the long term story has been much stronger than the recent noise.
- Recent coverage has highlighted Enterprise’s continued investment in expanding its pipeline and export infrastructure, reinforcing its role as a key player in US energy logistics. At the same time, the market has been recalibrating expectations around energy demand and interest rates, which helps explain the more muted short term price moves.
- On our numbers, Enterprise scores a solid 5/6 on valuation checks, suggesting it screens as undervalued on most metrics. Next, we will walk through how different valuation approaches stack up for this stock, before finishing with a more nuanced way to think about its true worth.
Approach 1: Enterprise Products Partners Discounted Cash Flow (DCF) Analysis
A Discounted Cash Flow model estimates what a business is worth by projecting the cash it can generate in the future and discounting those cash flows back to today in dollar terms.
For Enterprise Products Partners, the latest twelve-month Free Cash Flow is about $4.2 billion. Analysts expect this to rise steadily over the next few years, with projections and extrapolations pointing to Free Cash Flow of roughly $7.0 billion by 2029 and continuing to grow over the following decade. Simply Wall St uses a 2 Stage Free Cash Flow to Equity model. This combines these analyst estimates for the early years with more conservative, slowing growth assumptions further out.
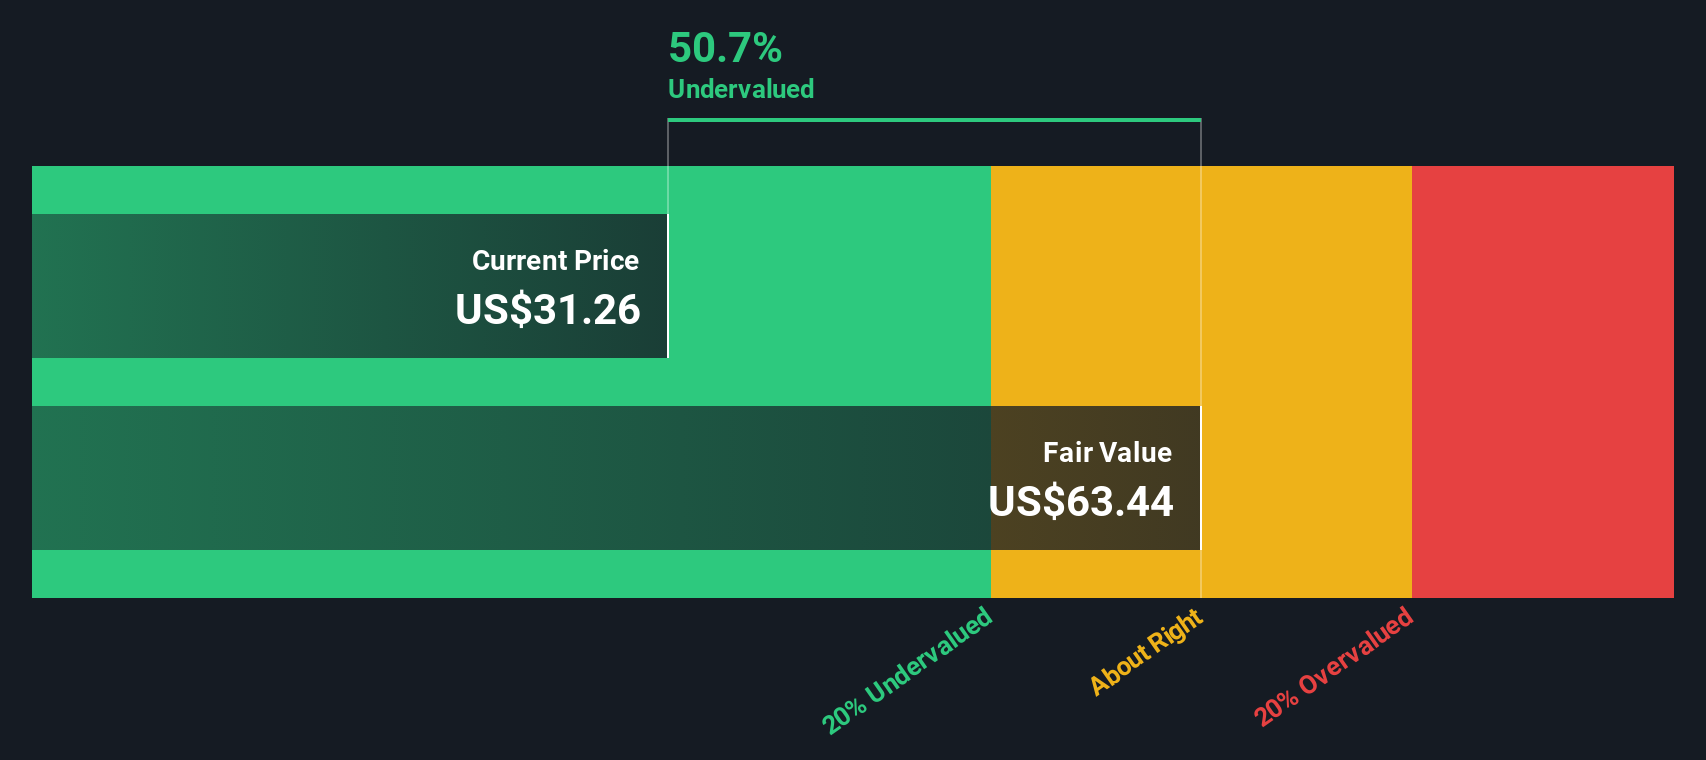
Pulling all of these discounted cash flows together results in an estimated intrinsic value of about $66.48 per unit. Compared with the current market price, this implies Enterprise Products Partners is trading at roughly a 52.2% discount to its calculated fair value. This suggests material upside if the cash flow path plays out as expected.
Result: UNDERVALUED
Our Discounted Cash Flow (DCF) analysis suggests Enterprise Products Partners is undervalued by 52.2%. Track this in your watchlist or portfolio, or discover 909 more undervalued stocks based on cash flows.
Approach 2: Enterprise Products Partners Price vs Earnings
For a mature, consistently profitable business like Enterprise Products Partners, the Price to Earnings, or PE, ratio is a useful shorthand for what investors are willing to pay for each dollar of current earnings. In general, companies with stronger growth prospects and lower perceived risk tend to justify a higher PE, while slower growth or higher uncertainty should translate into a lower, more conservative multiple.
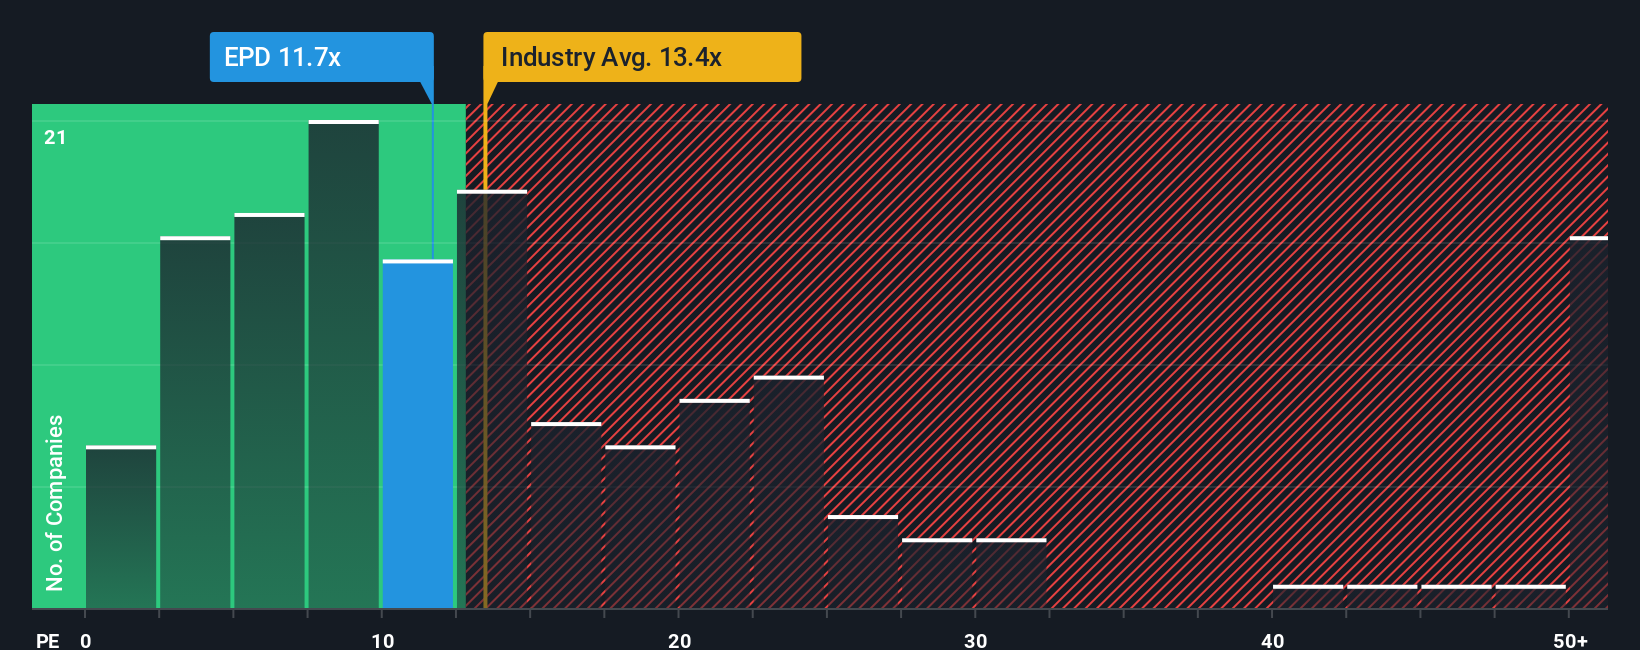
Enterprise currently trades at about 12.0x earnings, only slightly below the Oil and Gas industry average of around 12.8x, and meaningfully below the broader peer group average of about 19.0x. Simply Wall St’s proprietary Fair Ratio for Enterprise is higher still, at roughly 21.1x. This Fair Ratio reflects what investors might reasonably pay for the stock once factors like its earnings growth outlook, industry positioning, profit margins, market cap and risk profile are all taken into account.
Because the Fair Ratio is tailored to Enterprise’s specific fundamentals, it is a more nuanced benchmark than simple peer or industry comparisons. With the actual PE of 12.0x sitting well below the Fair Ratio of 21.1x, the multiple based view also points to meaningful undervaluation.
Result: UNDERVALUED
PE ratios tell one story, but what if the real opportunity lies elsewhere? Discover 1463 companies where insiders are betting big on explosive growth.
Upgrade Your Decision Making: Choose your Enterprise Products Partners Narrative
Earlier we mentioned that there is an even better way to understand valuation, so let's introduce you to Narratives, a simple way to connect your view of Enterprise Products Partners’ future to a concrete forecast and Fair Value estimate on Simply Wall St’s Community page, where millions of investors share their perspectives. A Narrative is your story behind the numbers, combining your assumptions about future revenue, earnings and margins with a valuation framework that turns those assumptions into an estimated Fair Value, which you can then compare to today’s price to decide whether the units look like a buy, hold or sell. Because Narratives on the platform update dynamically when new information like news or earnings arrives, your Fair Value view evolves as the story changes, instead of staying locked to a static model. For example, one Enterprise Products Partners Narrative might focus on infrastructure growth, buybacks and improving margins to support a Fair Value near the most optimistic analyst target of about $40. A more cautious Narrative might emphasize commodity and tariff risks and result in an estimate closer to the most conservative target of around $32, showing how different stories lead to different but transparent valuations.
Do you think there's more to the story for Enterprise Products Partners? Head over to our Community to see what others are saying!
This article by Simply Wall St is general in nature. We provide commentary based on historical data and analyst forecasts only using an unbiased methodology and our articles are not intended to be financial advice. It does not constitute a recommendation to buy or sell any stock, and does not take account of your objectives, or your financial situation. We aim to bring you long-term focused analysis driven by fundamental data. Note that our analysis may not factor in the latest price-sensitive company announcements or qualitative material. Simply Wall St has no position in any stocks mentioned.
Have feedback on this article? Concerned about the content? Get in touch with us directly. Alternatively, email editorial-team@simplywallst.com