
Is It Too Late to Consider Hecla Mining After Its 262% Surge in 2025?
- Wondering if Hecla Mining is still a bargain after its huge run, or if you are turning up late to the party? This breakdown will help you make sense of what the current share price really implies.
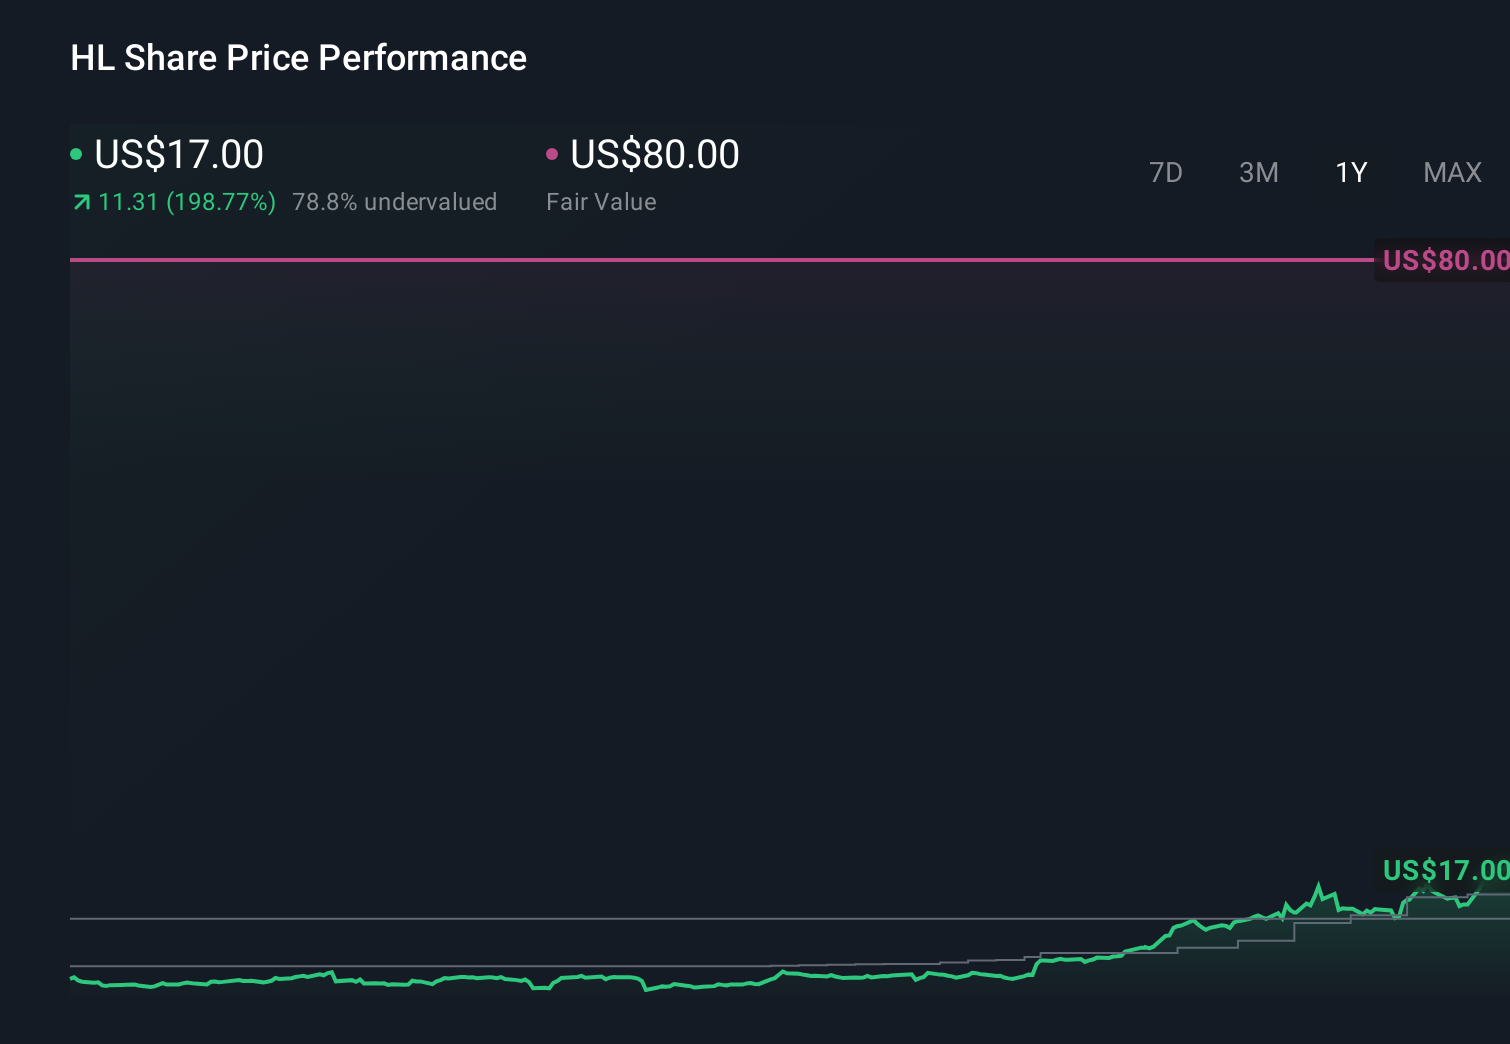
- The stock has surged recently, climbing 11.9% over the last week, 30.3% over the past month, and an eye catching 261.6% year to date. This has completely changed how the market is thinking about its risk and reward profile.
- That kind of move has been underpinned by a stronger silver price backdrop and growing investor interest in precious metals miners, as capital rotates toward assets seen as hedges against inflation and macro uncertainty. At the same time, Hecla has been highlighting its position as a leading US silver producer with leverage to long term demand themes, which is helping fuel renewed optimism around its growth potential.
- Despite that optimism, Hecla currently carries a valuation score of 2/6, meaning it screens as undervalued on only two of six checks. In this article we will unpack what that actually means across different valuation methods and hint at an even more insightful way to think about fair value by the end.
Hecla Mining scores just 2/6 on our valuation checks. See what other red flags we found in the full valuation breakdown.
Approach 1: Hecla Mining Discounted Cash Flow (DCF) Analysis
The Discounted Cash Flow model takes Hecla Mining’s expected future cash flows and then discounts them back to today to estimate what the business is worth right now in dollar terms.
Hecla generated around $124.5 million in Free Cash Flow over the last twelve months, and analysts expect this to climb rapidly over the coming decade. Simply Wall St aggregates analyst forecasts for the next few years and then extrapolates them, resulting in projected Free Cash Flow of roughly $1.97 billion by 2035. These rising cash flows are then discounted back using a required rate of return to reflect risk and the time value of money.
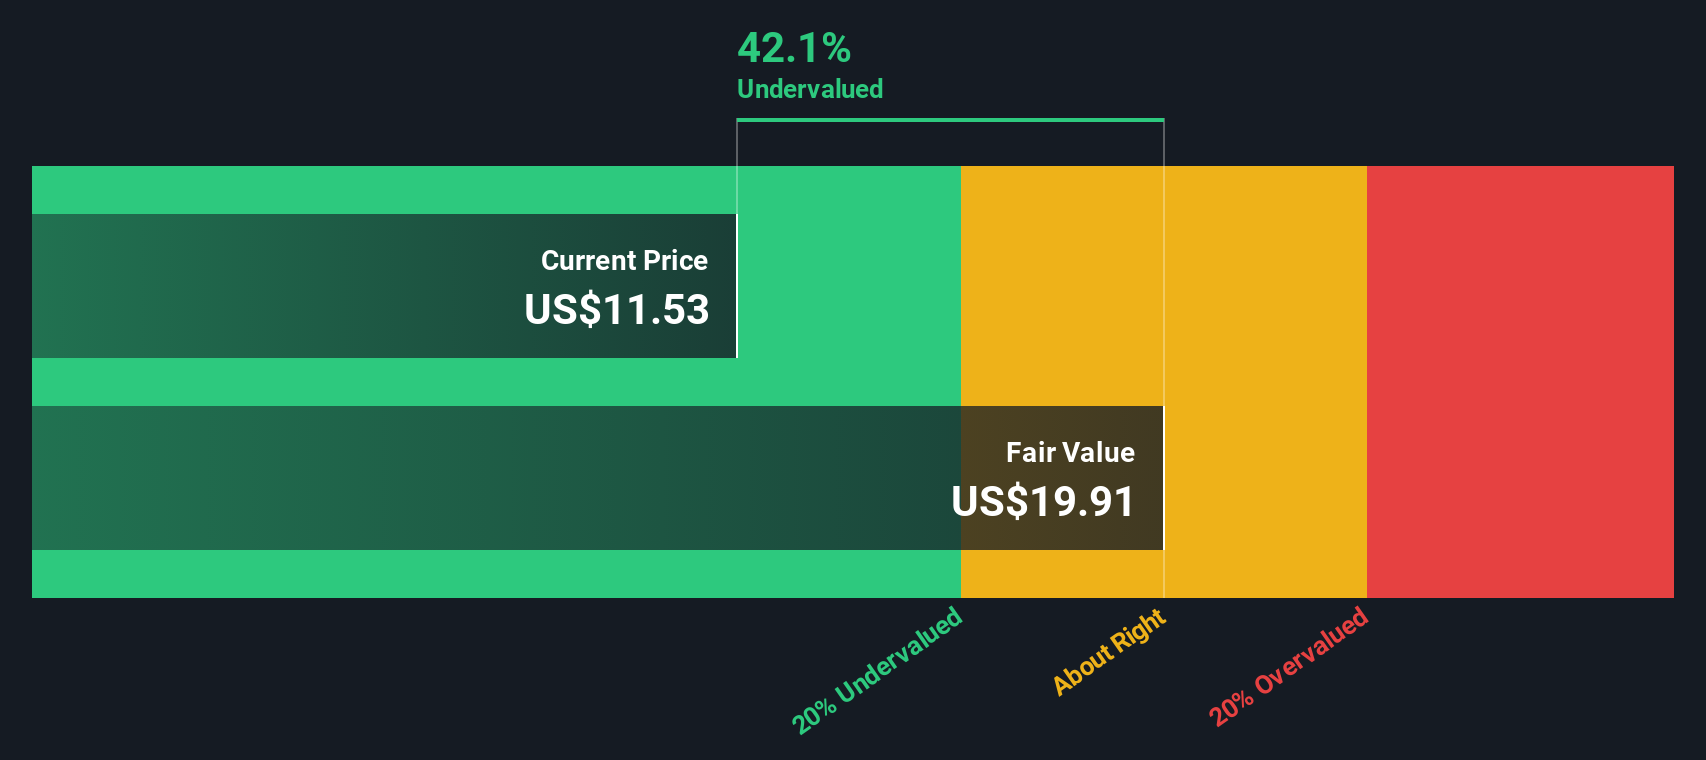
On this basis, the DCF model estimates an intrinsic value of about $41.47 per share. Compared with the current share price, this implies Hecla is trading at a 54.1% discount to its estimated fair value, suggesting the market is still pricing in far more pessimism than the cash flow outlook supports.
Result: UNDERVALUED
Our Discounted Cash Flow (DCF) analysis suggests Hecla Mining is undervalued by 54.1%. Track this in your watchlist or portfolio, or discover 914 more undervalued stocks based on cash flows.
Approach 2: Hecla Mining Price vs Earnings
For companies that are generating profits, the price to earnings ratio is a useful way to gauge how much investors are willing to pay today for each dollar of current earnings. In general, faster earnings growth and lower perceived risk justify a higher PE multiple, while slower growth or higher risk usually call for a lower one.
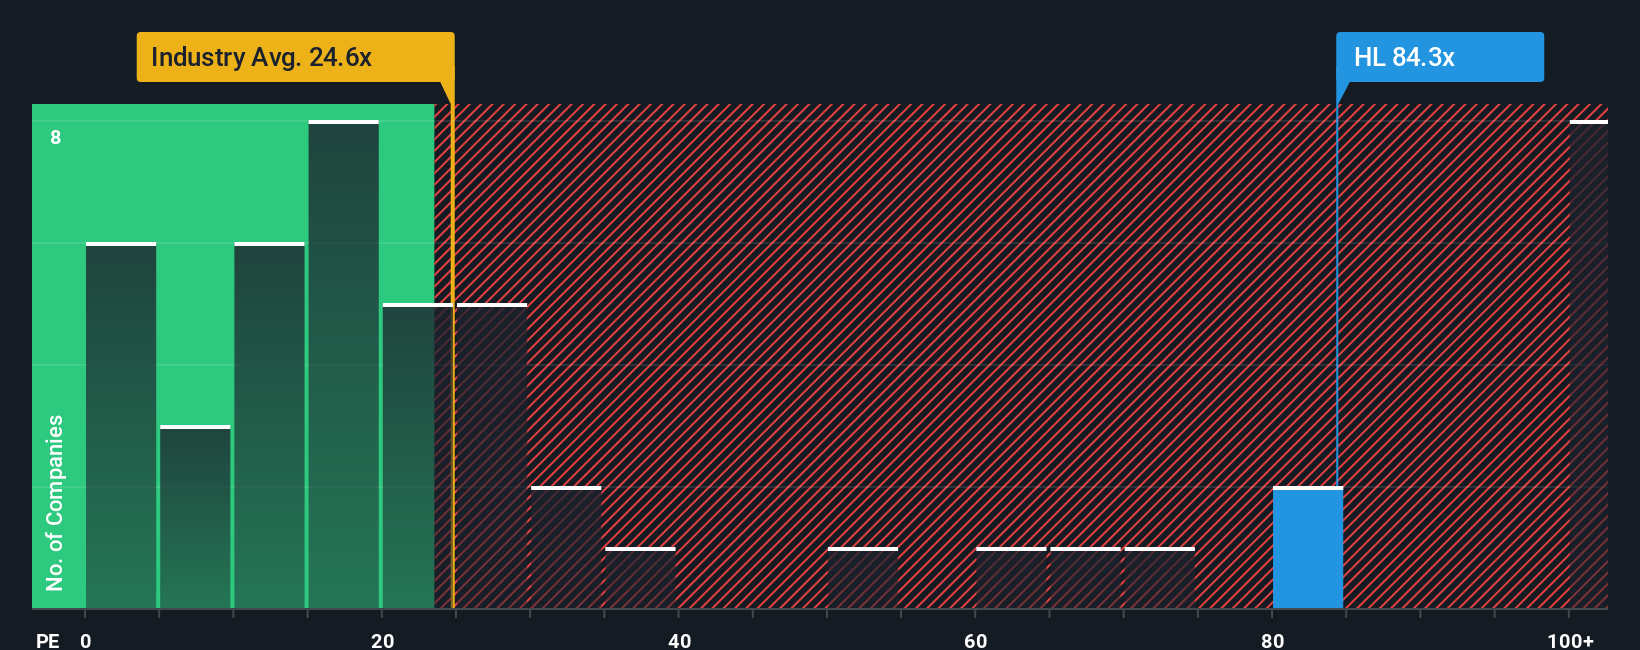
Hecla Mining currently trades on a PE of 64.15x, which is well above both the Metals and Mining industry average of about 24.25x and the broader peer group average of roughly 22.99x. Simply Wall St’s Fair Ratio framework goes a step further by estimating what PE multiple would be appropriate for Hecla specifically, given its earnings growth outlook, profitability, size, industry and risk profile. That Fair Ratio is 28.94x, which offers a more tailored benchmark than simple peer or industry comparisons because it adjusts for the company’s own fundamentals rather than assuming it should look like the average miner.
Comparing Hecla’s actual PE of 64.15x with the Fair Ratio of 28.94x suggests the stock is currently trading at a significant premium to what its fundamentals would typically warrant.
Result: OVERVALUED
PE ratios tell one story, but what if the real opportunity lies elsewhere? Discover 1461 companies where insiders are betting big on explosive growth.
Upgrade Your Decision Making, Choose your Hecla Mining Narrative
Earlier we mentioned that there is an even better way to understand valuation, so let us introduce you to Narratives, a simple way to connect your view of Hecla’s story with a concrete forecast and fair value estimate. A Narrative lets you spell out why you think Hecla’s revenue, earnings and margins will move a certain way, link those assumptions to a financial model, and see the fair value that drops out the other side. On Simply Wall St’s Community page, used by millions of investors, you can choose or create a Narrative, compare its Fair Value to today’s share price to decide whether Hecla looks like a buy, hold or sell, and then see that view update dynamically as new earnings, drilling results or guidance arrive. For example, one Narrative might lean into exploration success and electrification demand to support a higher fair value near 14.55 dollars. A more cautious Narrative, focused on costs, regulatory risk and dilution, might anchor closer to 6.50 dollars, showing how different perspectives on the same facts translate into very different investment decisions.
Do you think there's more to the story for Hecla Mining? Head over to our Community to see what others are saying!
This article by Simply Wall St is general in nature. We provide commentary based on historical data and analyst forecasts only using an unbiased methodology and our articles are not intended to be financial advice. It does not constitute a recommendation to buy or sell any stock, and does not take account of your objectives, or your financial situation. We aim to bring you long-term focused analysis driven by fundamental data. Note that our analysis may not factor in the latest price-sensitive company announcements or qualitative material. Simply Wall St has no position in any stocks mentioned.
Have feedback on this article? Concerned about the content? Get in touch with us directly. Alternatively, email editorial-team@simplywallst.com