
- PREMIUM
- LIVE QUOTES
- INSTITUTIONS
 Index Options
 State Street
 CME Group
 Nasdaq
 Cboe
Cboe TradingView
 Wall Street Journal
Is Nokia Still Attractive After 2025 Rally and 5G Infrastructure Momentum?
- Wondering if Nokia Oyj is still a value opportunity after its long slump and partial recovery, or if most of the upside has already been priced in? You are not alone. This is exactly the kind of setup where a closer look at valuation can really pay off.
- Despite slipping about 1.4% over the last week and 9.5% over the past month, the stock is still up 22.2% year to date and 29.2% over the last year, with gains of 34.4% over 3 years and 87.1% over 5 years. Those numbers hint at a story that is bigger than short term volatility.
- Recent headlines have focused on Nokia's push into 5G infrastructure deals and its efforts to win share in networks and cloud services, which help explain why investors have been willing to re rate the stock. At the same time, ongoing competitive pressure and shifting telecom capex budgets have added a layer of uncertainty that shows up in the share price swings.
- Right now Nokia scores just 1 out of 6 on our valuation checks, so on the surface it does not scream bargain, but headline multiples never tell the full story. Next we will walk through different valuation approaches to see what they are really implying for Nokia, before finishing with a more complete way to think about what the stock is worth and why.
Nokia Oyj scores just 1/6 on our valuation checks. See what other red flags we found in the full valuation breakdown.
Approach 1: Nokia Oyj Discounted Cash Flow (DCF) Analysis
A Discounted Cash Flow model estimates what a company is worth by projecting the cash it can generate in the future and discounting those cash flows back to today in €. For Nokia Oyj, the model used is a 2 Stage Free Cash Flow to Equity approach.
Nokia generated about €1.33 billion in free cash flow over the last twelve months, providing a solid base for the analysis. Analyst forecasts see free cash flow rising to roughly €1.82 billion by 2026 and €2.13 billion by 2027, before moderating in later years as Simply Wall St extrapolates beyond the explicit analyst horizon. By 2035, projected free cash flow is closer to €0.44 billion, reflecting a slowdown after the initial growth phase.
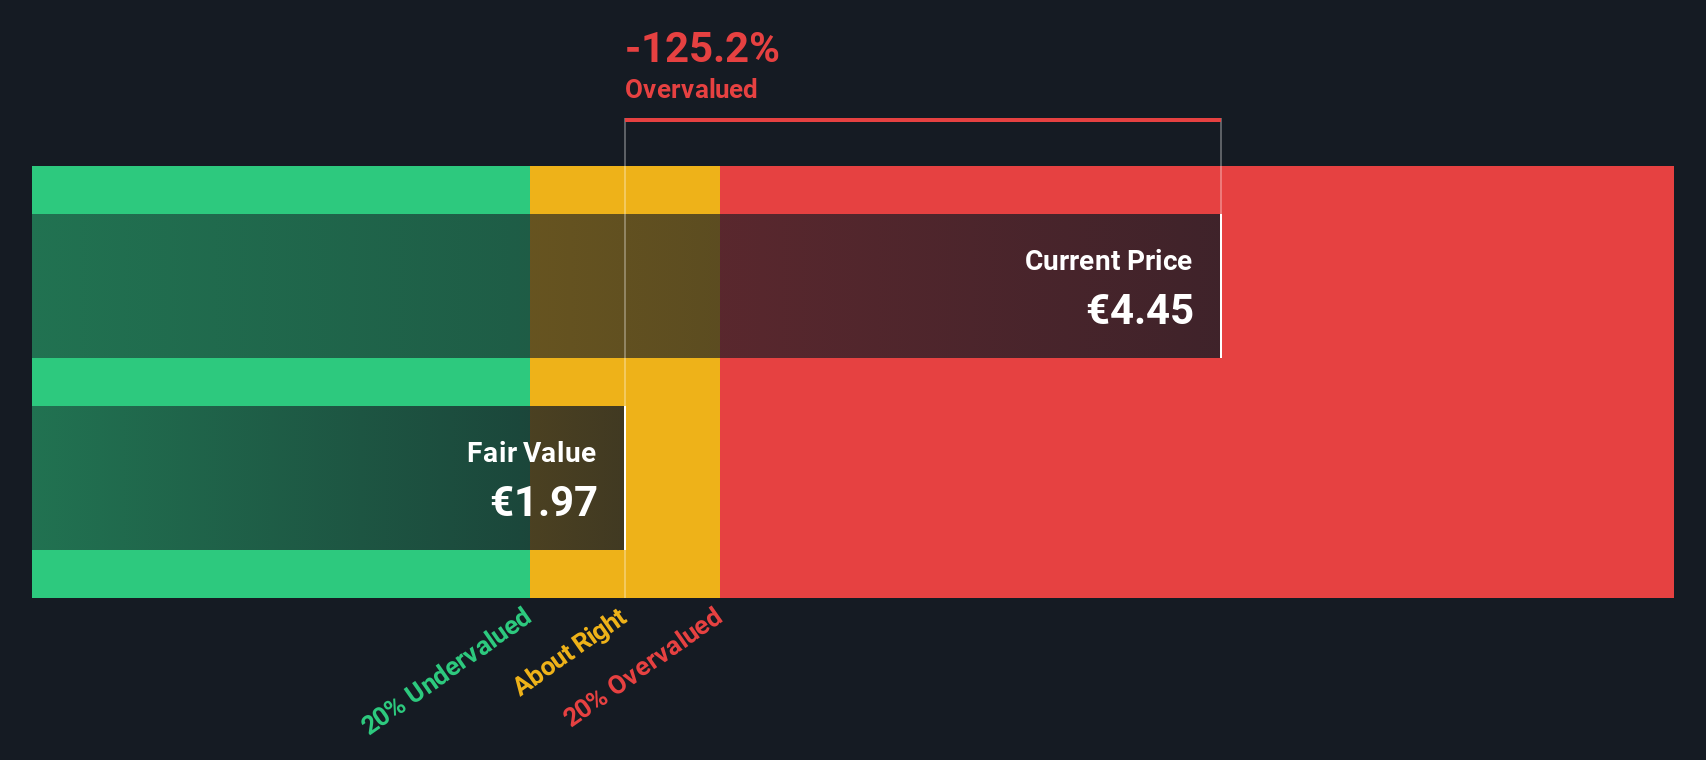
When all these future cash flows are discounted back, the resulting intrinsic value is about €1.99 per share. Compared with the current share price, the model implies Nokia is around 165.4% overvalued. This suggests the market is already pricing in highly optimistic expectations.
Result: OVERVALUED
Our Discounted Cash Flow (DCF) analysis suggests Nokia Oyj may be overvalued by 165.4%. Discover 915 undervalued stocks or create your own screener to find better value opportunities.
Approach 2: Nokia Oyj Price vs Earnings
For profitable companies like Nokia, the price to earnings ratio is often the most intuitive way to judge valuation, because it links what investors pay today to the profits the business is already generating. A higher PE can be justified when a company is expected to grow earnings faster and faces lower perceived risk, while a lower PE is more appropriate for slower or riskier businesses.
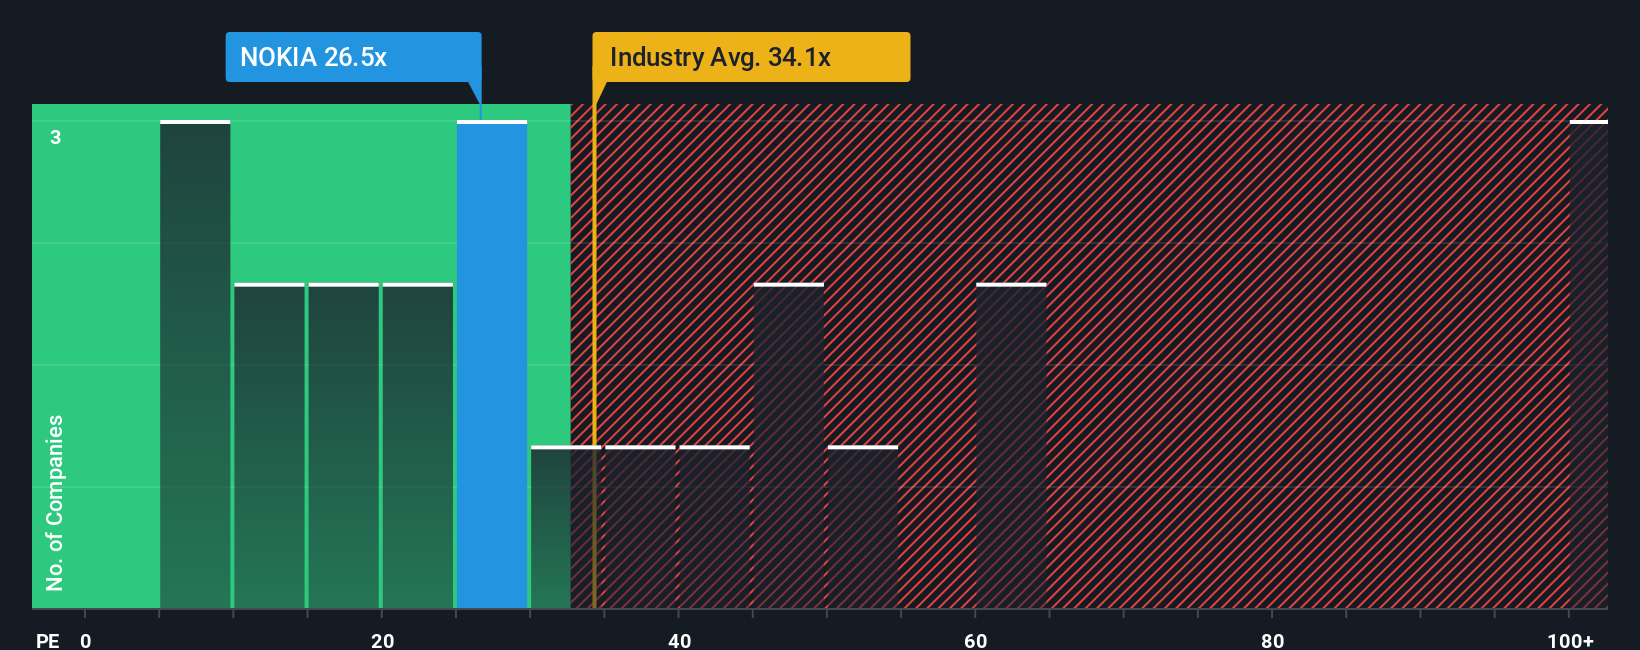
Nokia currently trades on a PE of about 34.8x, which sits slightly above the wider Communications industry average of roughly 33.8x and ahead of the peer group average of around 28.1x. On the surface, that suggests the market is willing to pay a premium multiple for Nokia compared with many of its rivals.
Simply Wall St’s Fair Ratio for Nokia is 32.3x, a proprietary estimate of what the PE should be once you factor in the company’s specific earnings growth outlook, profitability, industry positioning, market cap and risk profile. This makes it more tailored than a simple comparison to peer or industry averages. With the actual PE (34.8x) sitting above the Fair Ratio (32.3x), Nokia appears modestly expensive on this metric.
Result: OVERVALUED on this metric
PE ratios tell one story, but what if the real opportunity lies elsewhere? Discover 1460 companies where insiders are betting big on explosive growth.
Upgrade Your Decision Making: Choose your Nokia Oyj Narrative
Earlier we mentioned that there is an even better way to understand valuation, so let us introduce you to Narratives, a simple way to attach your story about Nokia Oyj to the numbers you think are realistic for its future revenue, earnings and margins.
A Narrative on Simply Wall St links three things together in one place: your view of Nokia’s business prospects, a financial forecast that reflects those assumptions, and a resulting Fair Value estimate that you can compare with today’s share price.
These Narratives live on the Community page of Simply Wall St, where millions of investors use them as an easy, accessible tool to decide whether Nokia looks buyable, holdable or sellable as its Fair Value moves above or below the current market Price.
Because Narratives update dynamically whenever new information arrives, such as earnings releases, network contract wins or changing analyst targets, your Fair Value view of Nokia can stay current without you rebuilding a model from scratch.
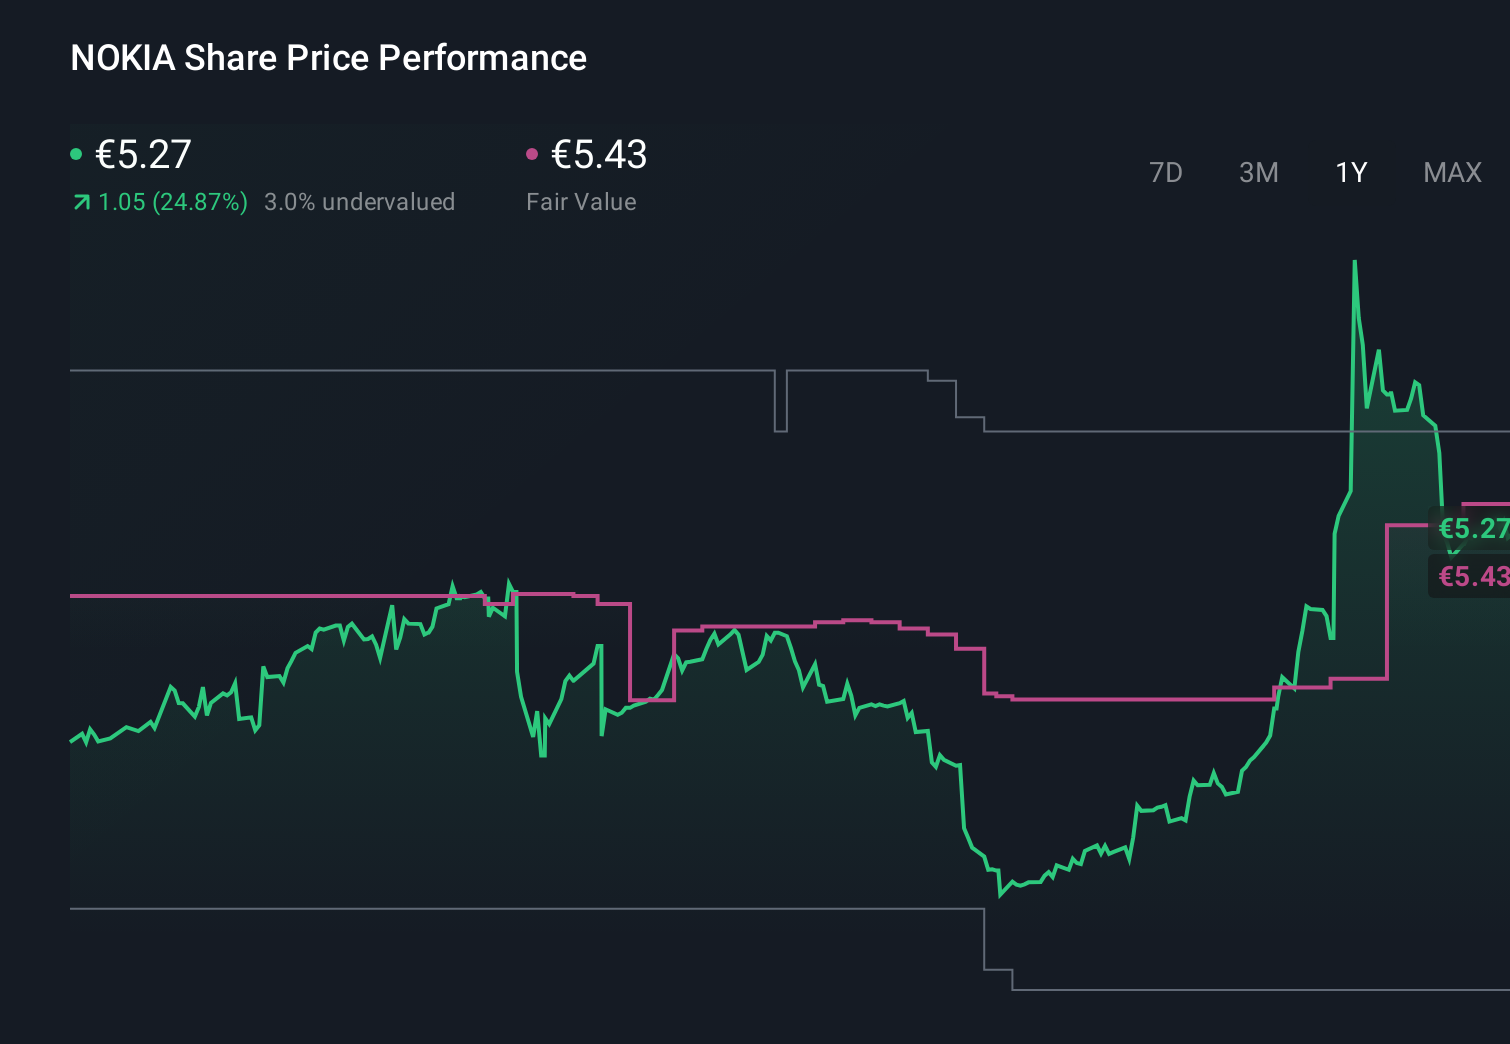
For example, one optimistic Nokia Narrative might lean on AI driven demand, optical strength and improving margins to support a Fair Value around €5.43 per share, while a more cautious Narrative might focus on capex headwinds and execution risks to justify a Fair Value closer to €3.00. This gives you a clear, numbers based way to choose which story you believe and how to act on it.
Do you think there's more to the story for Nokia Oyj? Head over to our Community to see what others are saying!
This article by Simply Wall St is general in nature. We provide commentary based on historical data and analyst forecasts only using an unbiased methodology and our articles are not intended to be financial advice. It does not constitute a recommendation to buy or sell any stock, and does not take account of your objectives, or your financial situation. We aim to bring you long-term focused analysis driven by fundamental data. Note that our analysis may not factor in the latest price-sensitive company announcements or qualitative material. Simply Wall St has no position in any stocks mentioned.
Have feedback on this article? Concerned about the content? Get in touch with us directly. Alternatively, email editorial-team@simplywallst.com