
- PREMIUM
- LIVE QUOTES
- INSTITUTIONS
 Index Options
 State Street
 CME Group
 Nasdaq
 Cboe
Cboe TradingView
 Wall Street Journal
Is Cenovus Energy’s Recent Pullback Creating a New Opportunity for Investors in 2025?
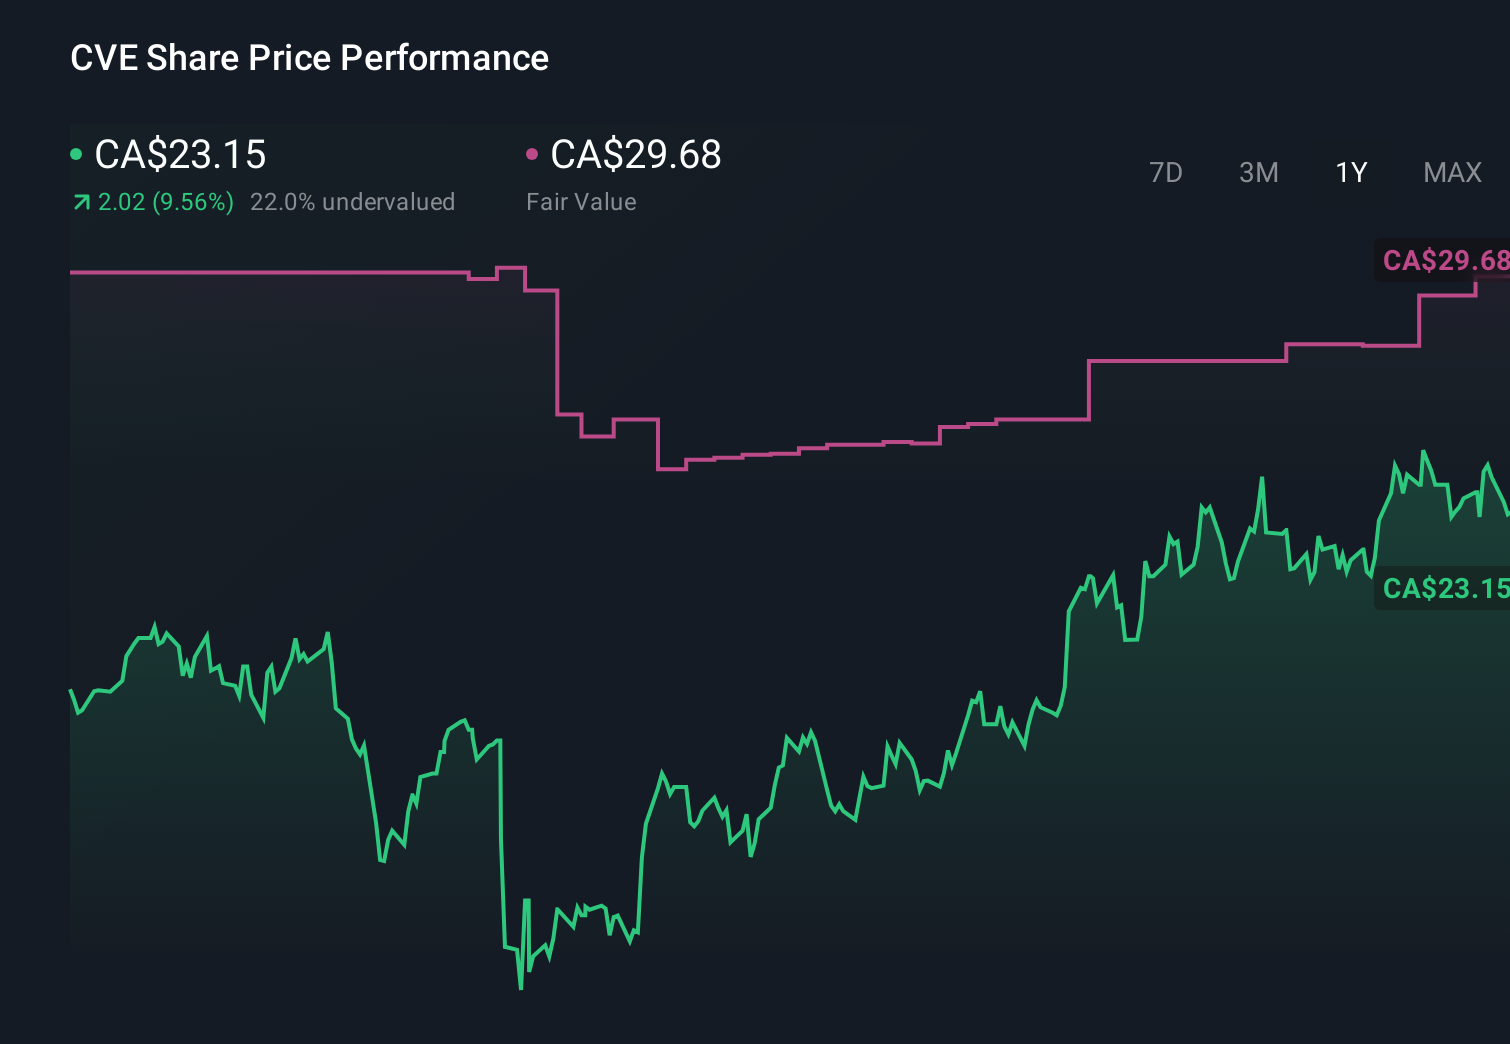
- If you are wondering whether Cenovus Energy is still a smart buy at today’s price, you are not alone. The stock’s recent moves have given value focused investors plenty to think about.
- Despite a 13.6% gain over the last year and a 262.8% climb over five years, the shares have pulled back recently, falling 5.9% over the past week and 8.9% over the last month. This could be opening up a fresh area of interest for patient investors.
- Part of this volatility reflects shifting sentiment around oil prices and Canadian energy policy, as investors react to headlines on production discipline, export capacity, and longer term demand for fossil fuels. At the same time, Cenovus has been in the news for its ongoing balance sheet strengthening and capital allocation plans, which help frame how the market is rethinking both its risk and reward profile.
- Against that backdrop, Cenovus screens as materially undervalued on our fundamentals based framework, earning a 6/6 valuation score. We will unpack this using several different methods, before finishing with a more intuitive way to think about what the market might be missing.
Find out why Cenovus Energy's 13.6% return over the last year is lagging behind its peers.
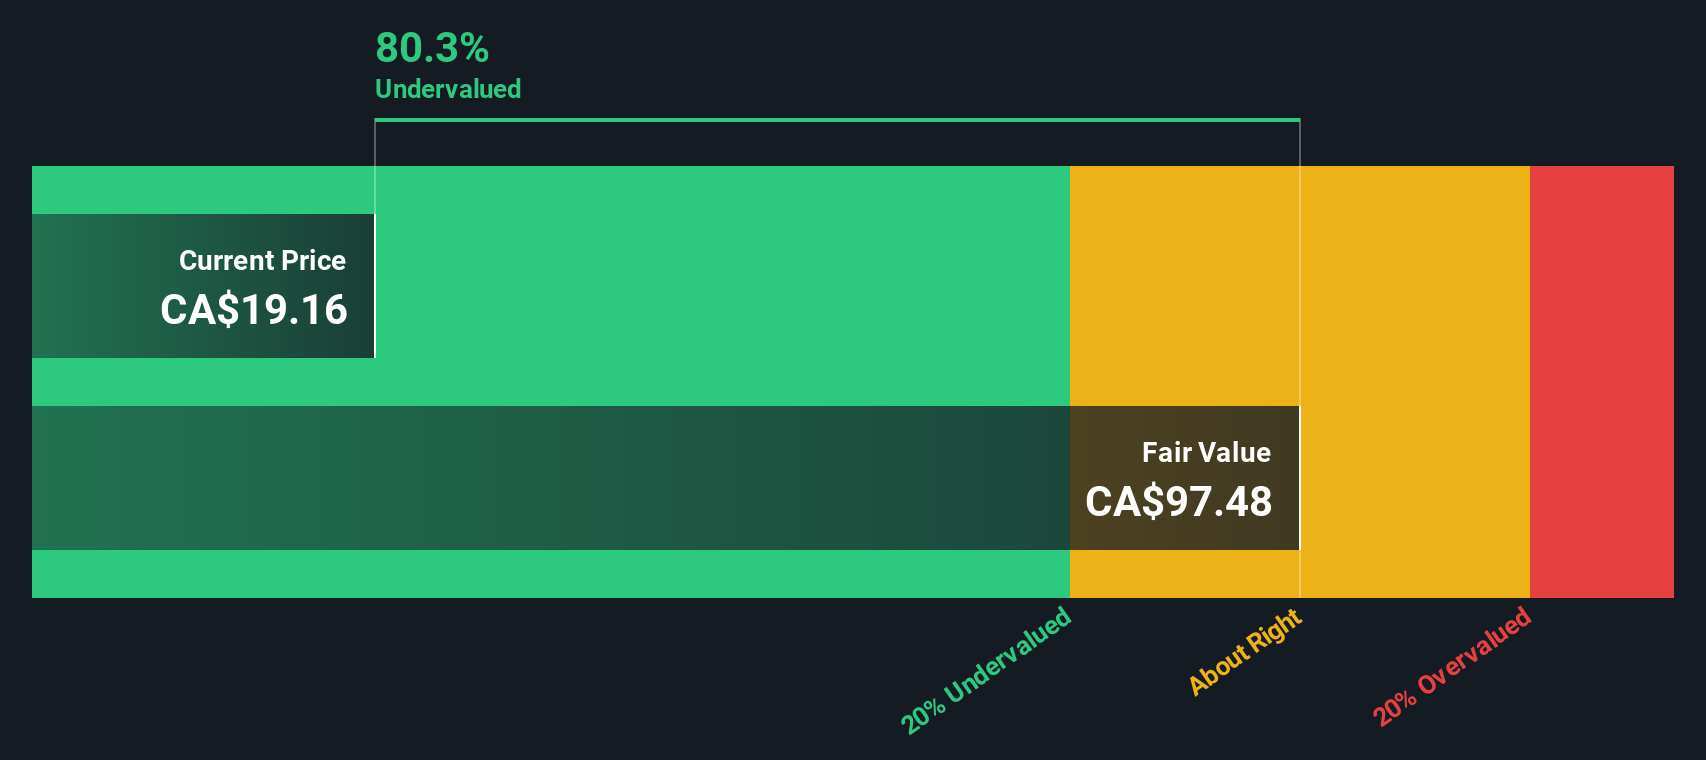
Approach 1: Cenovus Energy Discounted Cash Flow (DCF) Analysis
A Discounted Cash Flow model estimates what a business is worth by projecting the cash it can generate in the future and then discounting those cash flows back to today in CA$, adjusting for risk and time.
For Cenovus Energy, the latest twelve month free cash flow is about CA$3.27 billion. Analysts expect this to rise steadily, with projections and extrapolations pointing to free cash flow of roughly CA$6.84 billion in ten years. The early years of the forecast are based on analyst estimates, while the later years are extrapolated by Simply Wall St using a 2 Stage Free Cash Flow to Equity framework.
When all these future cash flows are discounted back, the model arrives at an estimated intrinsic value of CA$82.60 per share. Compared with the current market price, this implies the shares trade at about a 72.0% discount to their DCF based value. This suggests investors may be significantly underpricing Cenovus relative to its projected cash generation.
Result: UNDERVALUED
Our Discounted Cash Flow (DCF) analysis suggests Cenovus Energy is undervalued by 72.0%. Track this in your watchlist or portfolio, or discover 909 more undervalued stocks based on cash flows.
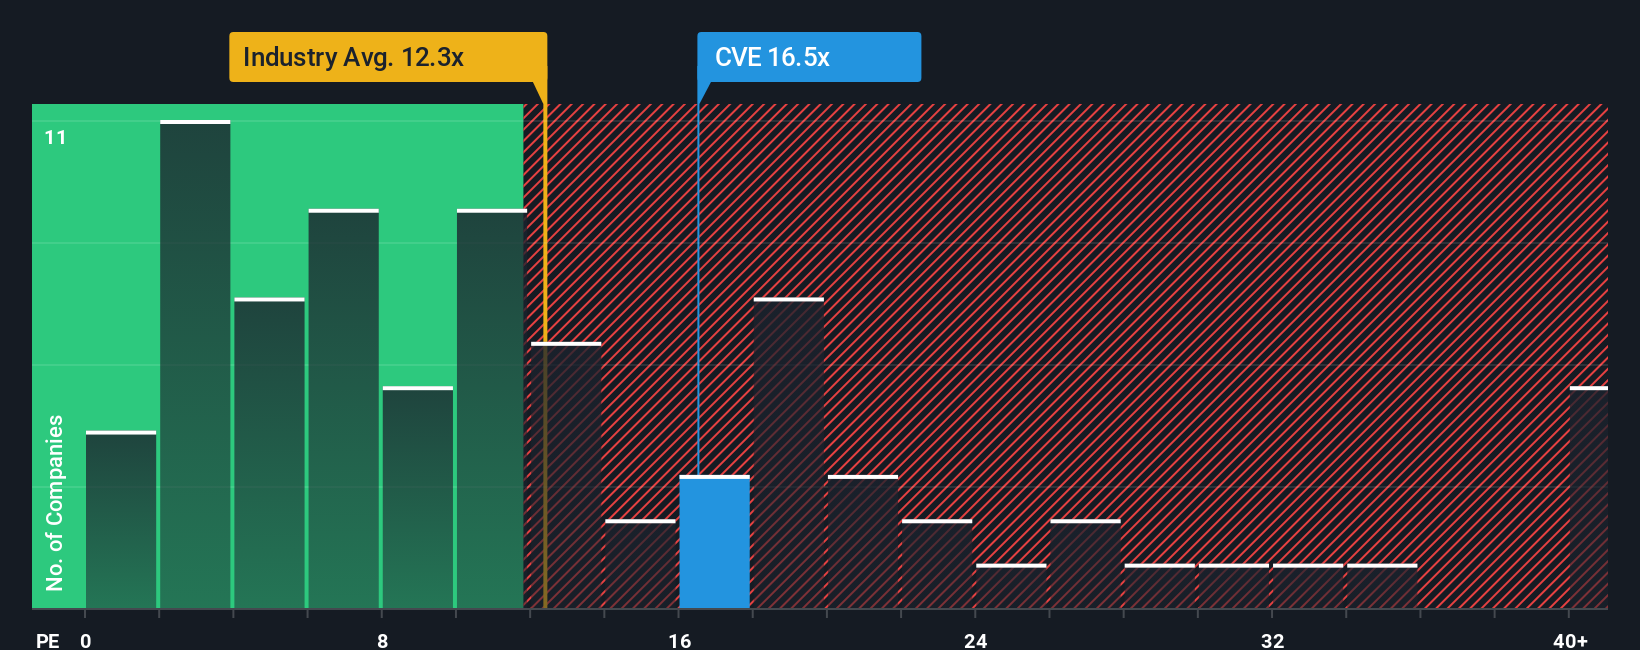
Approach 2: Cenovus Energy Price vs Earnings
For profitable businesses like Cenovus Energy, the price to earnings ratio is a straightforward way to gauge whether investors are paying a sensible price for each dollar of current earnings. In general, companies with stronger growth prospects and lower perceived risk can justify a higher PE multiple, while slower growth or higher risk should translate into a lower, more conservative PE.
Cenovus currently trades on a PE of about 13.99x, which is slightly below the Oil and Gas industry average of roughly 14.80x and also under the broader peer group average of around 16.45x. To move beyond these broad comparisons, Simply Wall St calculates a Fair Ratio of 17.37x for Cenovus, which reflects its specific earnings growth outlook, profitability, industry positioning, size and risk profile. This Fair Ratio is more informative than a simple industry or peer comparison because it is tailored to Cenovus, rather than assuming that all energy companies deserve the same multiple.
Comparing the current PE of 13.99x with the Fair Ratio of 17.37x suggests the market is assigning a discount to Cenovus relative to what its fundamentals might warrant.
Result: UNDERVALUED
PE ratios tell one story, but what if the real opportunity lies elsewhere? Discover 1456 companies where insiders are betting big on explosive growth.
Upgrade Your Decision Making: Choose your Cenovus Energy Narrative
Earlier we mentioned that there is an even better way to understand valuation. Let us introduce Narratives: simple, story driven forecasts where you describe how you see Cenovus evolving, link that story to assumptions about future revenue, earnings and margins, and instantly translate it into a Fair Value you can compare to today’s price on Simply Wall St’s Community page. This page is used by millions of investors, with the platform dynamically updating each Narrative when fresh information like MEG integration news, new guidance or earnings is released. For example, a bullish investor who believes buybacks and project completions will drive sustained margin expansion might support a Fair Value near CA$32.00. In contrast, a more cautious investor who focuses on regulatory risk and energy transition headwinds could anchor closer to CA$21.00. By setting up and tracking these contrasting Cenovus Narratives side by side, you can decide when to buy, hold or sell based on how your story driven Fair Value compares to the live market price.
Do you think there's more to the story for Cenovus Energy? Head over to our Community to see what others are saying!
This article by Simply Wall St is general in nature. We provide commentary based on historical data and analyst forecasts only using an unbiased methodology and our articles are not intended to be financial advice. It does not constitute a recommendation to buy or sell any stock, and does not take account of your objectives, or your financial situation. We aim to bring you long-term focused analysis driven by fundamental data. Note that our analysis may not factor in the latest price-sensitive company announcements or qualitative material. Simply Wall St has no position in any stocks mentioned.
Have feedback on this article? Concerned about the content? Get in touch with us directly. Alternatively, email editorial-team@simplywallst.com