
- PREMIUM
- LIVE QUOTES
- INSTITUTIONS
 Index Options
 State Street
 CME Group
 Nasdaq
 Cboe
Cboe TradingView
 Wall Street Journal
Compass (COMP): Reassessing Valuation After Google Tests Direct Home Listing Search Tool
Compass (COMP) slid about 4% after investors digested reports that Google is testing home listing results directly in search, which could pose a potential long term headwind for traffic, agent engagement, and platform economics.
See our latest analysis for Compass.
Even with today’s pullback on the Google news, Compass’s 30 day share price return of roughly 10% and powerful year to date share price return near 80% suggest positive momentum. A standout three year total shareholder return above 300% shows the longer term thesis is still very much alive.
If this kind of platform risk has you thinking about diversification, it could be worth exploring fast growing stocks with high insider ownership as a way to uncover other high conviction growth stories.
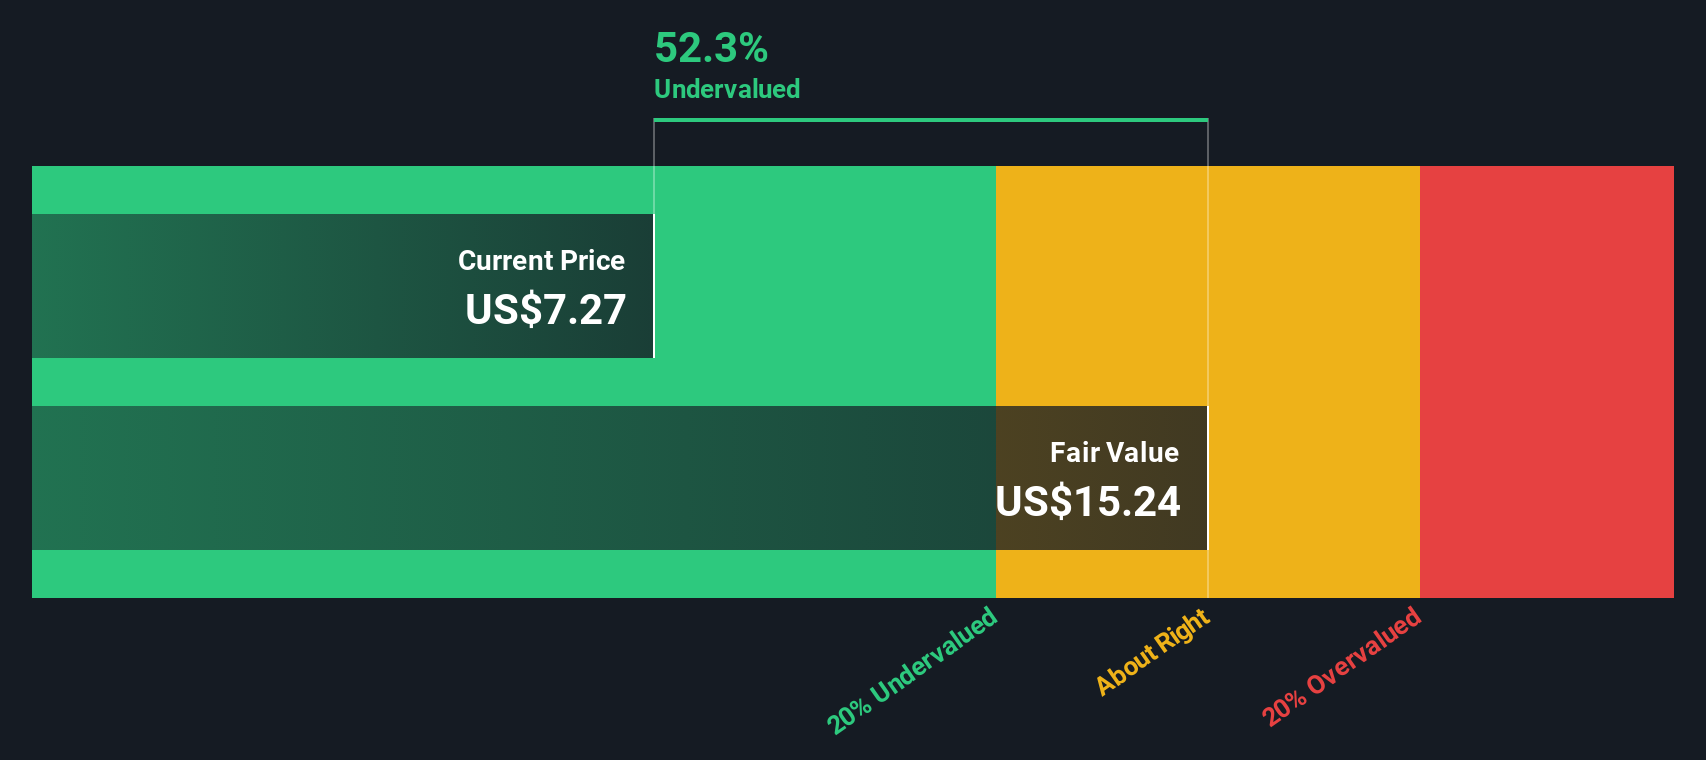
With the stock still trading at a near 30% discount to one intrinsic value estimate, but hovering close to Wall Street’s price target, investors now face a key question: Is Compass undervalued or already pricing in its next leg of growth?
Most Popular Narrative Narrative: 1.2% Overvalued
With Compass last closing at $10.34 versus a most popular narrative fair value near $10.22, the story leans only slightly rich and hinges on ambitious integration upside.
The combined platform is expected to generate pro forma 2025 revenue of roughly $12.8B, which, when paired with targeted cost synergies, is seen as a catalyst for operating leverage and multiple expansion.
Curious how a modest premium price leans on bold revenue scaling, margin lift, and a richer future earnings multiple than today? Want to see the full playbook?
Result: Fair Value of $10.22 (OVERVALUED)
Have a read of the narrative in full and understand what's behind the forecasts.
However, structural shifts in commission models and heightened regulatory scrutiny could compress margins and disrupt agent retention, pressuring Compass’s growth-dependent valuation narrative.
Find out about the key risks to this Compass narrative.
Another Angle on Valuation
While the narrative based fair value hints at slight overvaluation, the SWS DCF model paints a different picture, suggesting Compass is trading about 30% below its estimated intrinsic value. If the cash flow story proves right, is the market underestimating how durable Compass’s economics really are?
Look into how the SWS DCF model arrives at its fair value.
Build Your Own Compass Narrative
If you see the data differently or want to stress test your own assumptions, you can build a personalized Compass narrative in just minutes with Do it your way.
A good starting point is our analysis highlighting 3 key rewards investors are optimistic about regarding Compass.
Looking for more investment ideas?
Do not stop at Compass. Sharpen your edge by tapping into focused stock ideas that align with your strategy before the next wave of opportunities passes you by.
- Capture potential multi-baggers early by scanning these 3627 penny stocks with strong financials with robust balance sheets and room to run.
- Position yourself at the frontier of innovation by targeting these 25 AI penny stocks shaping the future of intelligent automation and data driven decision making.
- Explore more predictable income streams by reviewing these 13 dividend stocks with yields > 3% that combine yields with underlying fundamentals.
This article by Simply Wall St is general in nature. We provide commentary based on historical data and analyst forecasts only using an unbiased methodology and our articles are not intended to be financial advice. It does not constitute a recommendation to buy or sell any stock, and does not take account of your objectives, or your financial situation. We aim to bring you long-term focused analysis driven by fundamental data. Note that our analysis may not factor in the latest price-sensitive company announcements or qualitative material. Simply Wall St has no position in any stocks mentioned.
Have feedback on this article? Concerned about the content? Get in touch with us directly. Alternatively, email editorial-team@simplywallst.com