
- PREMIUM
- LIVE QUOTES
- INSTITUTIONS
 Index Options
 State Street
 CME Group
 Nasdaq
 Cboe
Cboe TradingView
 Wall Street Journal
Assessing STMicroelectronics After Recent 8.4% Rebound and Long Term Cash Flow Outlook
- Wondering whether STMicroelectronics is a bargain or a value trap at current levels? You are not alone, but we can walk through the numbers in a clear and practical way.
- After a choppy few years that left the stock down 34.3% over three years and 23.9% over five, the recent 8.4% rise over the last month suggests sentiment might be starting to shift, even though it is still down 7.3% year to date and 8.8% over the past year.
- Investors have been reacting to a mix of macro signals from the broader semiconductor cycle and company specific updates around its positioning in automotive, industrial and power electronics, sectors that tend to be more resilient than consumer focused chip markets. At the same time, ongoing headlines about supply chain normalization and capital spending across the chip industry are shaping expectations for how quickly STMicroelectronics can return to a stronger growth path.
- Right now STMicroelectronics scores a 4/6 valuation check rating. This tells us it screens as undervalued on most, but not all, of our standard metrics. We will break down what that actually means across multiple valuation approaches and, by the end, look at a more holistic way to judge whether the stock is genuinely mispriced.
Approach 1: STMicroelectronics Discounted Cash Flow (DCF) Analysis
A Discounted Cash Flow model estimates what a company is worth by projecting the cash it can generate in the future and then discounting those cash flows back to today in dollar terms. For STMicroelectronics, this is done using a 2 Stage Free Cash Flow to Equity approach based on cash flow projections.
The latest twelve month free cash flow is negative at about $746 Million, reflecting a heavy investment phase rather than mature cash generation. Looking ahead, analyst forecasts and Simply Wall St extrapolations point to free cash flow rising steadily, reaching roughly $2.97 Billion by 2035 as automotive, industrial and power markets scale. These ten year projections are all converted into today’s dollars using a discount rate to reflect risk and the time value of money.
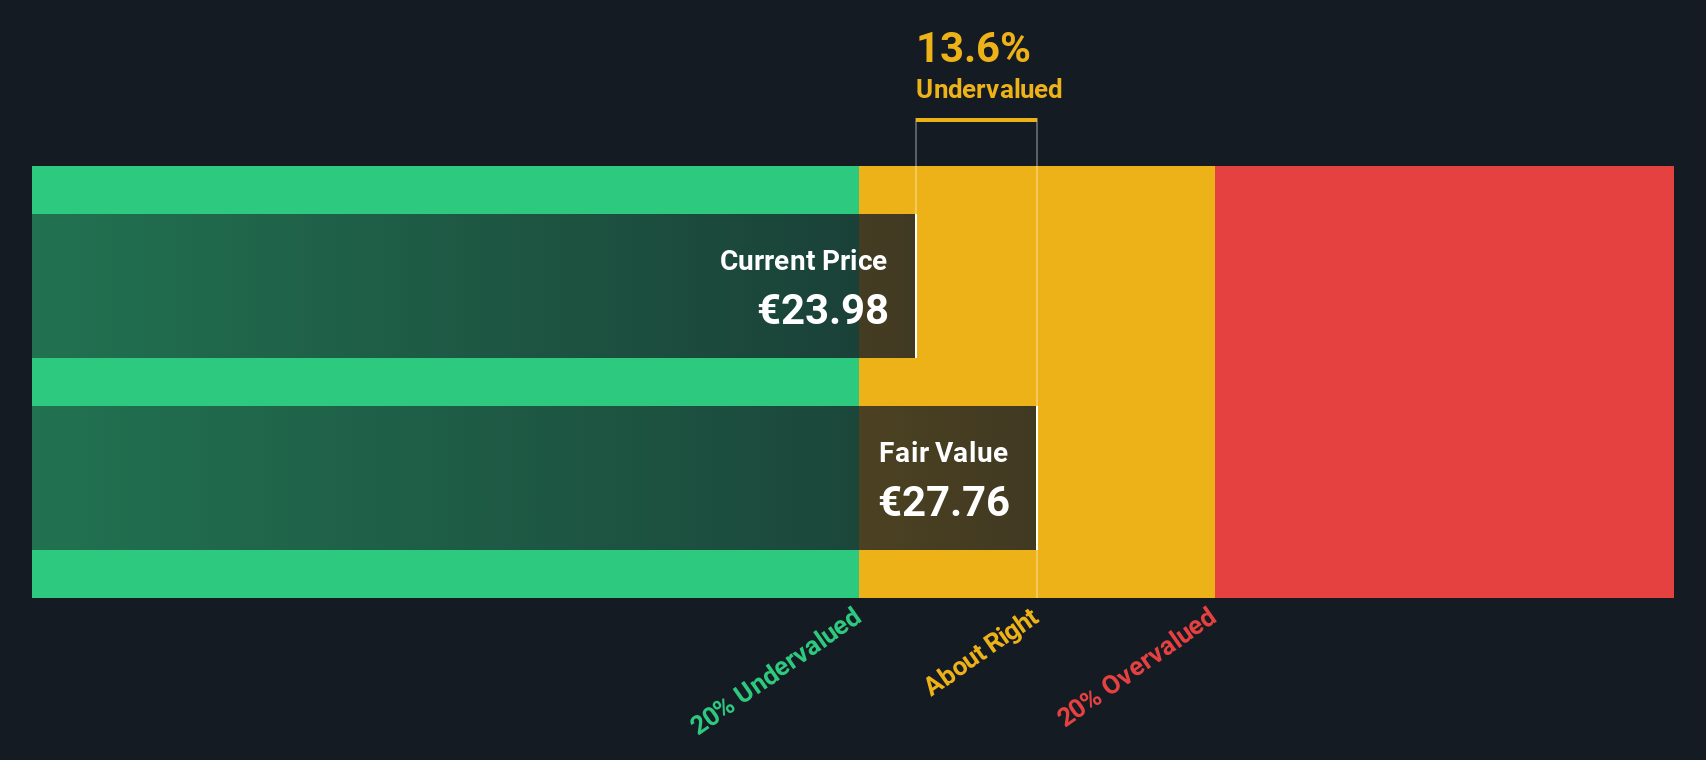
Adding the discounted cash flows together gives an estimated intrinsic value of about €30.18 per share. Against the current market price, this implies the stock is roughly 26.9% undervalued.
Result: UNDERVALUED
Our Discounted Cash Flow (DCF) analysis suggests STMicroelectronics is undervalued by 26.9%. Track this in your watchlist or portfolio, or discover 909 more undervalued stocks based on cash flows.
Approach 2: STMicroelectronics Price vs Earnings
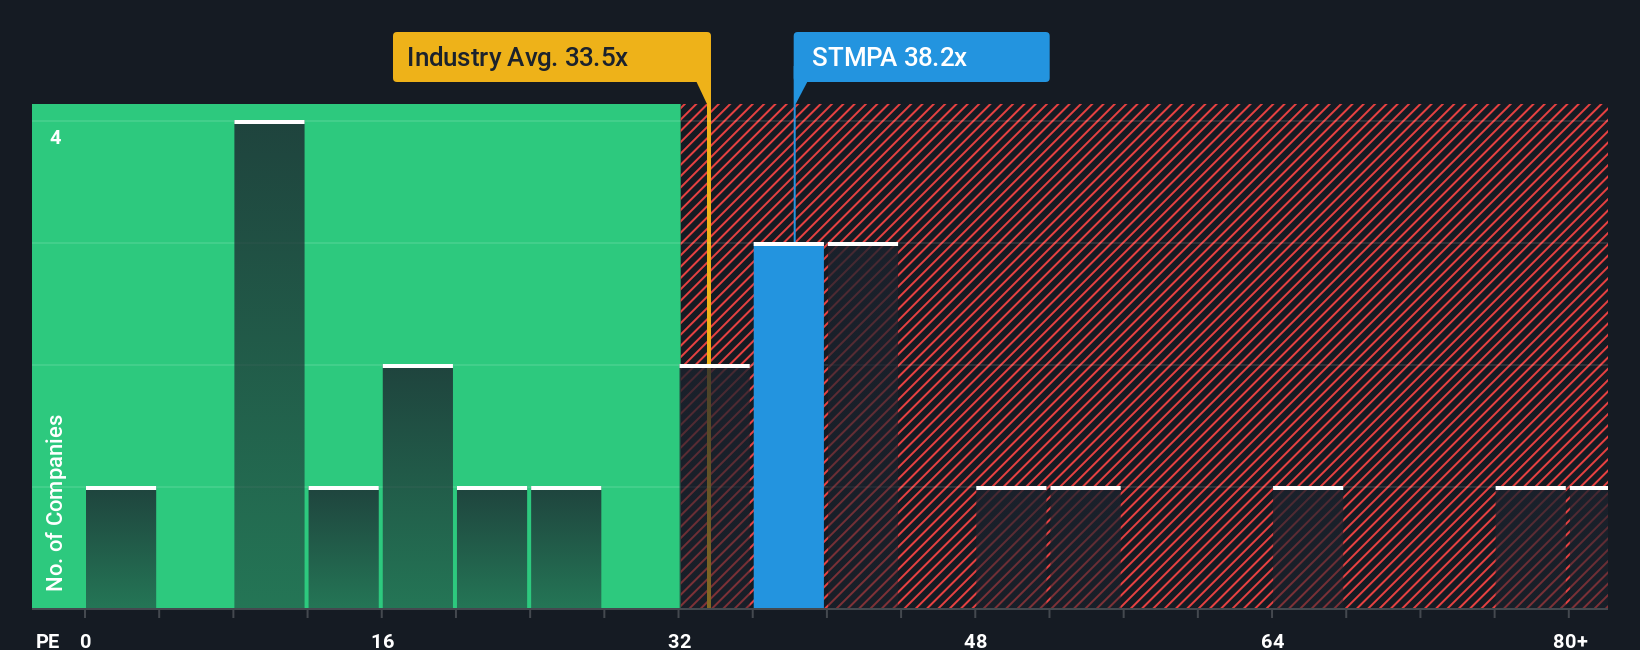
For a profitable company like STMicroelectronics, the Price to Earnings, or PE, ratio is a practical way to gauge value because it links what investors pay today to the profits the business generates. In general, faster earnings growth and lower perceived risk justify a higher, or more expensive, PE multiple, while slower growth or higher risk usually warrant a lower one.
STMicroelectronics currently trades on a PE of about 42.9x, which is above the broader Semiconductor industry average of roughly 35.0x but below its peer group average of around 54.8x. To move beyond simple comparisons, Simply Wall St calculates a proprietary Fair Ratio, the PE level that would be reasonable given the company’s specific earnings growth outlook, profitability, industry, size and risk profile. This tailored Fair Ratio for STMicroelectronics is 45.5x.
Because the Fair Ratio folds in factors like growth, risks, profit margins, industry dynamics and market cap, it gives a more nuanced view than just lining the stock up against peers. Comparing 42.9x to a Fair Ratio of 45.5x suggests investors are paying slightly less than what these fundamentals would justify, pointing to a modest discount rather than excessive optimism.
Result: UNDERVALUED
PE ratios tell one story, but what if the real opportunity lies elsewhere? Discover 1456 companies where insiders are betting big on explosive growth.
Upgrade Your Decision Making: Choose your STMicroelectronics Narrative
Earlier we mentioned that there is an even better way to understand valuation, so let's introduce you to Narratives, a simple way to connect your view of STMicroelectronics' future to a concrete forecast and Fair Value, then compare that to today's share price to help inform a decision on whether to buy, hold or sell.
A Narrative is your story about a company, written in numbers, where you spell out how you think revenue, earnings and profit margins will evolve and the platform automatically turns that into a financial forecast and a Fair Value estimate.
On Simply Wall St, millions of investors use Narratives within the Community page as an easy, accessible tool, because you do not need to build your own spreadsheet or DCF model. You just adjust assumptions to match your view and the valuation updates instantly.
These Narratives are dynamic, updating as new information like earnings releases, news or guidance arrives. This means your fair value and the gap between Fair Value and the current share price stay current instead of going stale after one big research session.
For STMicroelectronics, for example, one optimistic Narrative might assume revenue grows around 9 to 10 percent a year with profit margins rising toward about 14 percent, supporting a Fair Value near the top of the analyst range around €31.05. A more cautious Narrative might expect slower growth and margin pressure, driving a Fair Value closer to the lower end of about €20.09 and seeing less upside at today's price.
Do you think there's more to the story for STMicroelectronics? Head over to our Community to see what others are saying!

This article by Simply Wall St is general in nature. We provide commentary based on historical data and analyst forecasts only using an unbiased methodology and our articles are not intended to be financial advice. It does not constitute a recommendation to buy or sell any stock, and does not take account of your objectives, or your financial situation. We aim to bring you long-term focused analysis driven by fundamental data. Note that our analysis may not factor in the latest price-sensitive company announcements or qualitative material. Simply Wall St has no position in any stocks mentioned.
Have feedback on this article? Concerned about the content? Get in touch with us directly. Alternatively, email editorial-team@simplywallst.com