
- PREMIUM
- LIVE QUOTES
- INSTITUTIONS
 Index Options
 State Street
 CME Group
 Nasdaq
 Cboe
Cboe TradingView
 Wall Street Journal
With 70% ownership, Lendlease Group (ASX:LLC) boasts of strong institutional backing
Key Insights
- Given the large stake in the stock by institutions, Lendlease Group's stock price might be vulnerable to their trading decisions
- A total of 9 investors have a majority stake in the company with 54% ownership
- Using data from analyst forecasts alongside ownership research, one can better assess the future performance of a company
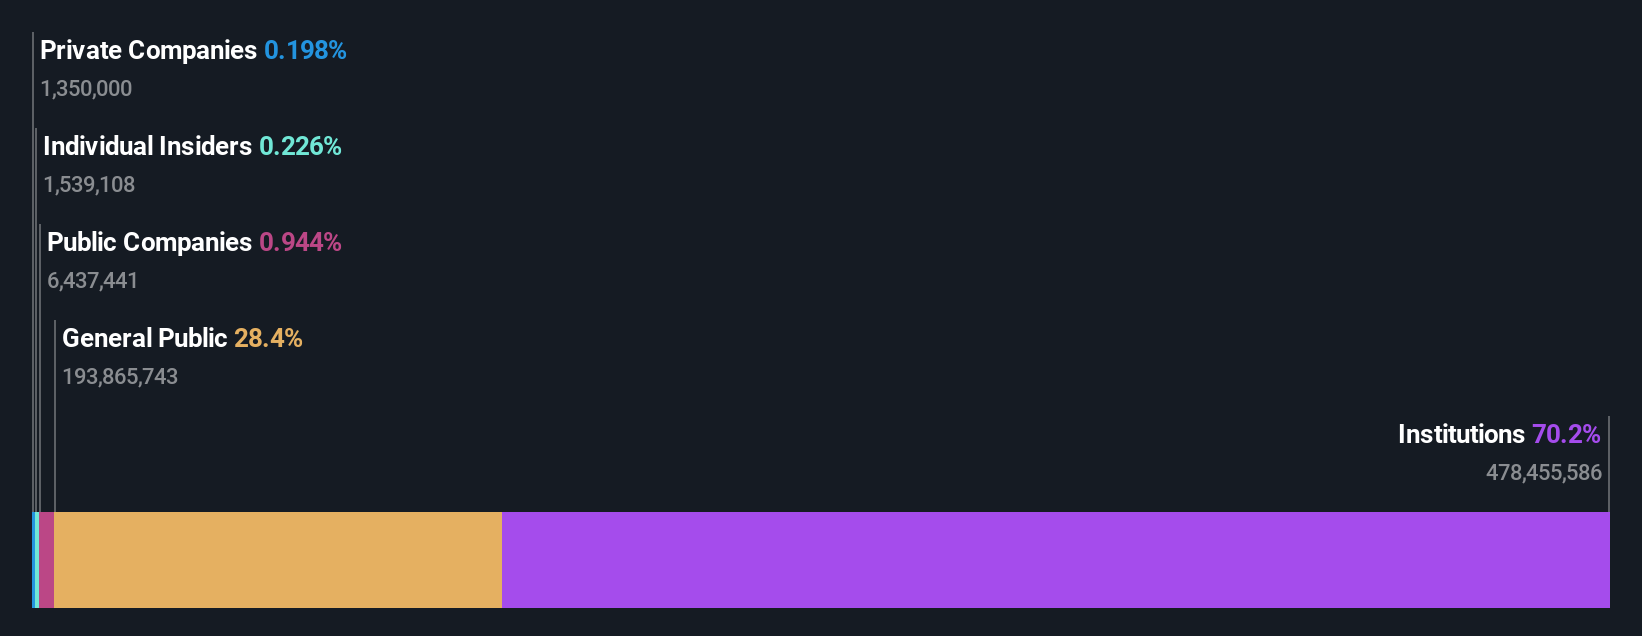
To get a sense of who is truly in control of Lendlease Group (ASX:LLC), it is important to understand the ownership structure of the business. With 70% stake, institutions possess the maximum shares in the company. That is, the group stands to benefit the most if the stock rises (or lose the most if there is a downturn).
Because institutional owners have a huge pool of resources and liquidity, their investing decisions tend to carry a great deal of weight, especially with individual investors. As a result, a sizeable amount of institutional money invested in a firm is generally viewed as a positive attribute.
In the chart below, we zoom in on the different ownership groups of Lendlease Group.
Check out our latest analysis for Lendlease Group
What Does The Institutional Ownership Tell Us About Lendlease Group?
Institutional investors commonly compare their own returns to the returns of a commonly followed index. So they generally do consider buying larger companies that are included in the relevant benchmark index.
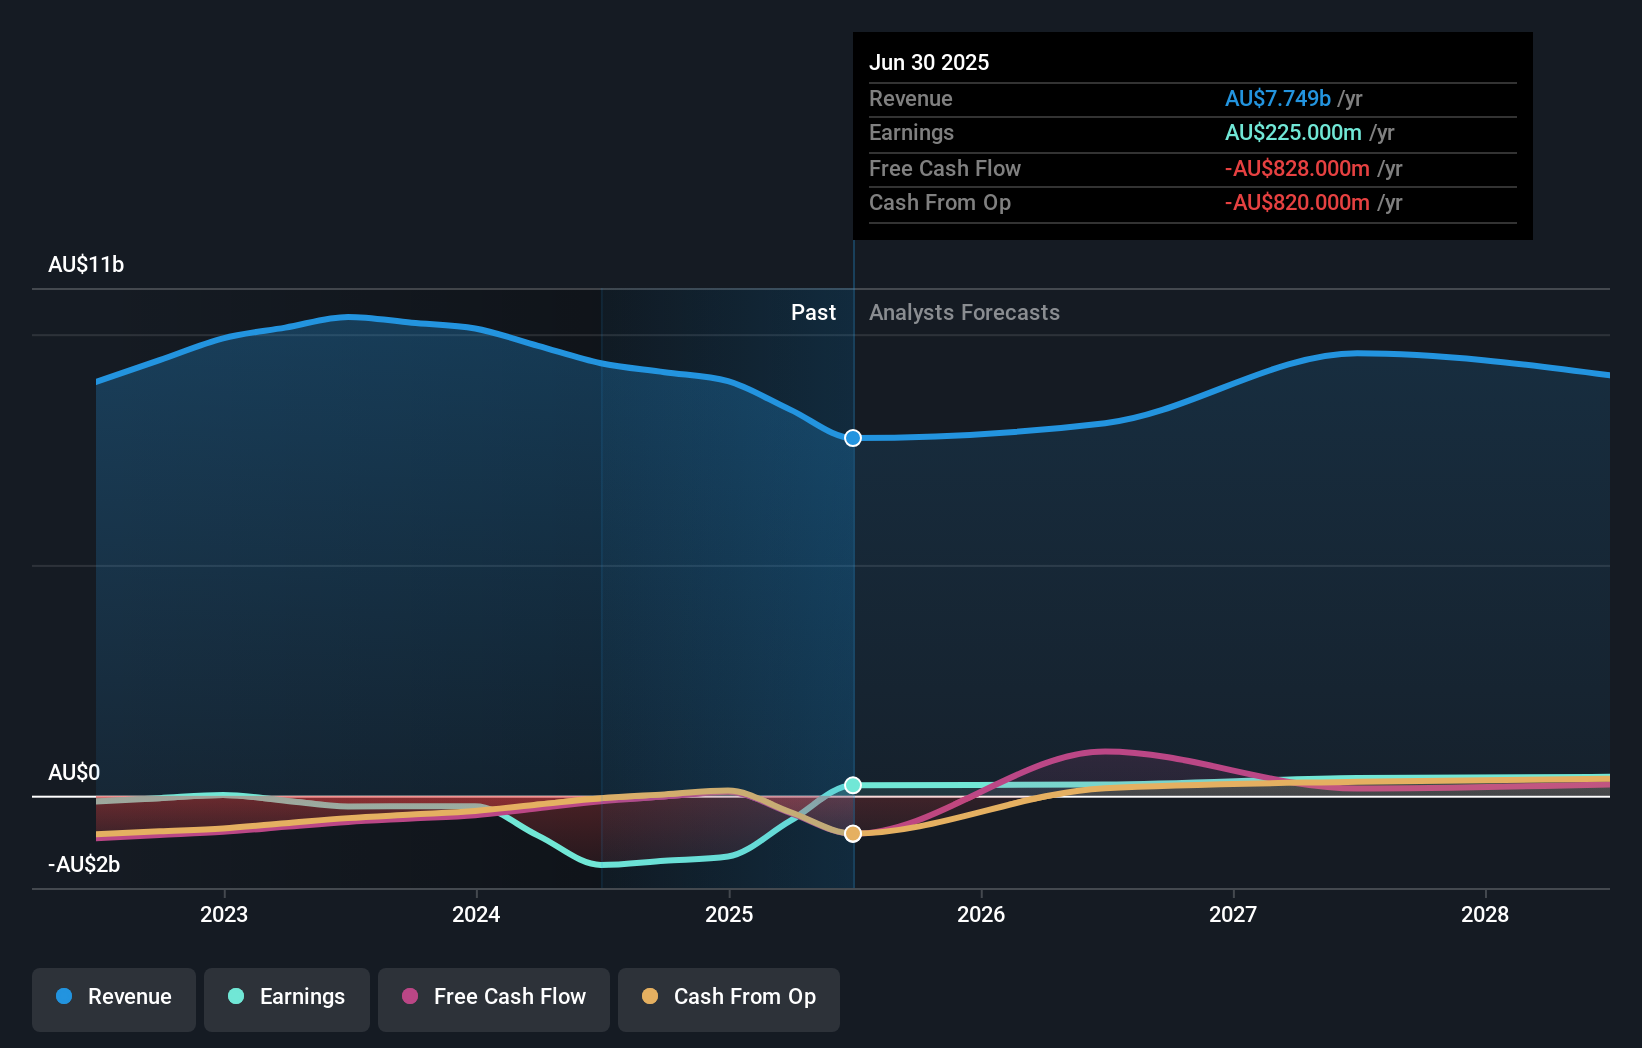
We can see that Lendlease Group does have institutional investors; and they hold a good portion of the company's stock. This implies the analysts working for those institutions have looked at the stock and they like it. But just like anyone else, they could be wrong. When multiple institutions own a stock, there's always a risk that they are in a 'crowded trade'. When such a trade goes wrong, multiple parties may compete to sell stock fast. This risk is higher in a company without a history of growth. You can see Lendlease Group's historic earnings and revenue below, but keep in mind there's always more to the story.
Institutional investors own over 50% of the company, so together than can probably strongly influence board decisions. Hedge funds don't have many shares in Lendlease Group. Allan Gray Australia Pty Limited is currently the largest shareholder, with 8.4% of shares outstanding. Aware Super Pty Ltd is the second largest shareholder owning 7.6% of common stock, and The Vanguard Group, Inc. holds about 6.2% of the company stock.
On further inspection, we found that more than half the company's shares are owned by the top 9 shareholders, suggesting that the interests of the larger shareholders are balanced out to an extent by the smaller ones.
While studying institutional ownership for a company can add value to your research, it is also a good practice to research analyst recommendations to get a deeper understand of a stock's expected performance. Quite a few analysts cover the stock, so you could look into forecast growth quite easily.
Insider Ownership Of Lendlease Group
The definition of an insider can differ slightly between different countries, but members of the board of directors always count. Company management run the business, but the CEO will answer to the board, even if he or she is a member of it.
Insider ownership is positive when it signals leadership are thinking like the true owners of the company. However, high insider ownership can also give immense power to a small group within the company. This can be negative in some circumstances.
Our data suggests that insiders own under 1% of Lendlease Group in their own names. Keep in mind that it's a big company, and the insiders own AU$7.7m worth of shares. The absolute value might be more important than the proportional share. It is good to see board members owning shares, but it might be worth checking if those insiders have been buying.
General Public Ownership
The general public-- including retail investors -- own 28% stake in the company, and hence can't easily be ignored. While this size of ownership may not be enough to sway a policy decision in their favour, they can still make a collective impact on company policies.
Next Steps:
While it is well worth considering the different groups that own a company, there are other factors that are even more important. Case in point: We've spotted 3 warning signs for Lendlease Group you should be aware of, and 1 of them can't be ignored.
If you are like me, you may want to think about whether this company will grow or shrink. Luckily, you can check this free report showing analyst forecasts for its future.
NB: Figures in this article are calculated using data from the last twelve months, which refer to the 12-month period ending on the last date of the month the financial statement is dated. This may not be consistent with full year annual report figures.
Have feedback on this article? Concerned about the content? Get in touch with us directly. Alternatively, email editorial-team (at) simplywallst.com.
This article by Simply Wall St is general in nature. We provide commentary based on historical data and analyst forecasts only using an unbiased methodology and our articles are not intended to be financial advice. It does not constitute a recommendation to buy or sell any stock, and does not take account of your objectives, or your financial situation. We aim to bring you long-term focused analysis driven by fundamental data. Note that our analysis may not factor in the latest price-sensitive company announcements or qualitative material. Simply Wall St has no position in any stocks mentioned.