
- PREMIUM
- LIVE QUOTES
- INSTITUTIONS
 Index Options
 State Street
 CME Group
 Nasdaq
 Cboe
Cboe TradingView
 Wall Street Journal
Is HNI Offering Value After Recent Share Price Recovery and Office Demand Headlines?
- Wondering if HNI is quietly turning into a value opportunity while most investors are looking elsewhere? Here is a look at what the market might be missing.
- HNI's share price has ticked up about 2.0% over the last week and 6.0% over the last month, even though it is still down 15.9% year to date and 20.8% over the last year. Zooming out, the stock is up 70.3% over 3 years and 41.6% over 5 years, which may point to a longer term recovery story beneath the recent weakness.
- Recent headlines around office demand, workplace transformation and contract furnishings have put HNI back on some investors' radar as they reassess which players can adapt and potentially win share. At the same time, broader discussions about commercial real estate pressures and corporate spending cuts have made the near term outlook feel more uncertain, which helps explain the choppy trading pattern.
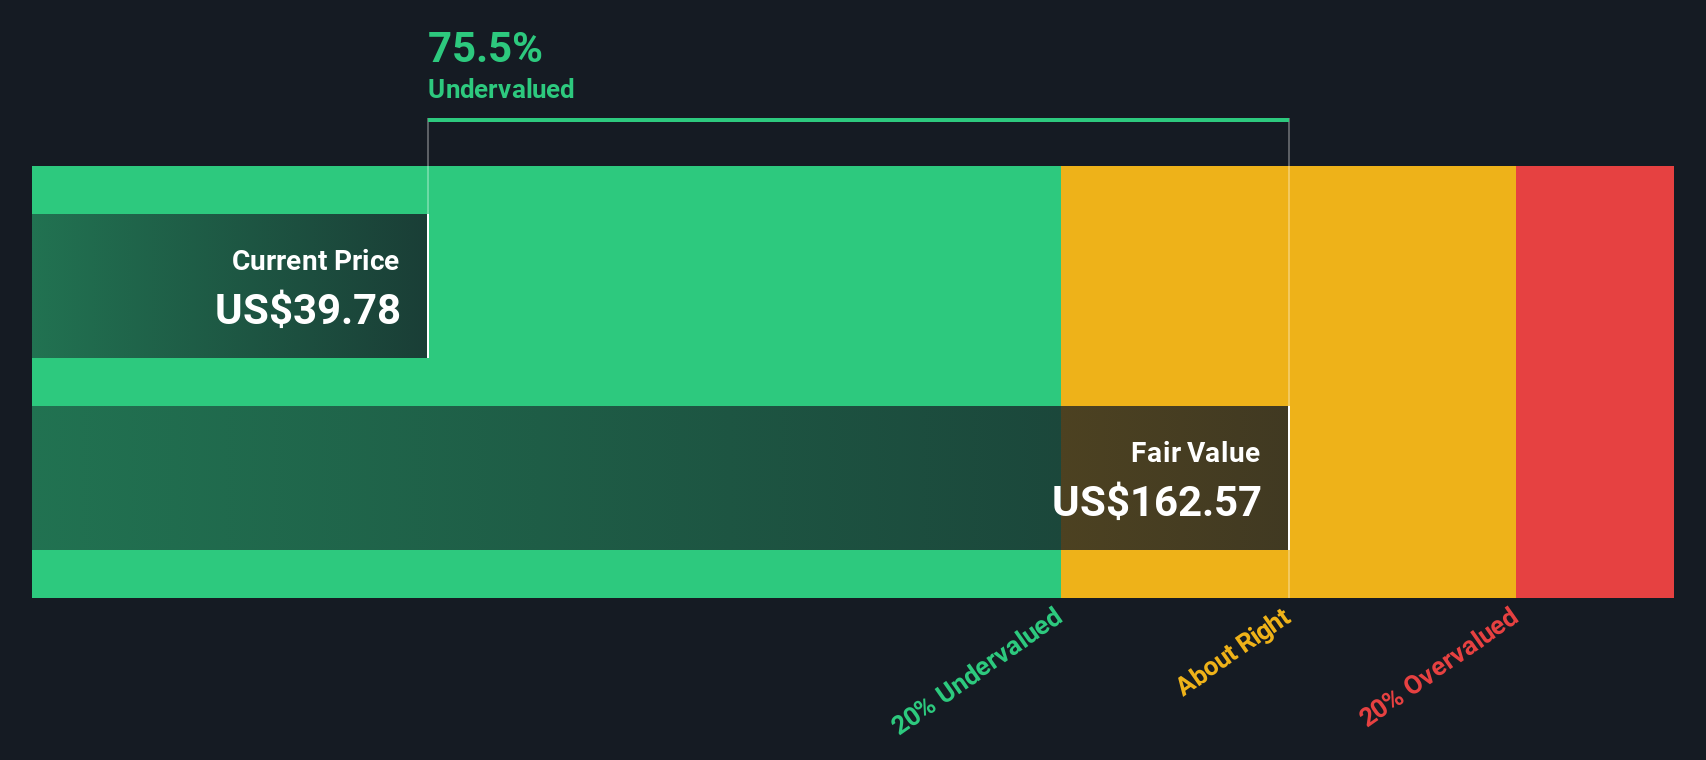
- On our numbers, HNI scores a strong 6/6 valuation checks, suggesting it looks undervalued across all of our standard tests. In the next sections we will unpack those valuation methods one by one, then finish by looking at a more complete way to judge what HNI might be worth.
Find out why HNI's -20.8% return over the last year is lagging behind its peers.
Approach 1: HNI Discounted Cash Flow (DCF) Analysis
A Discounted Cash Flow, or DCF, model estimates what a business is worth by projecting the cash it could generate in the future and discounting those cash flows back to today. For HNI, the model used is a 2 Stage Free Cash Flow to Equity approach, which starts with near term forecasts and then tapers growth in later years.
HNI generated roughly $179.9 Million in free cash flow over the last twelve months, and analysts see this rising steadily, with Simply Wall St extrapolating the trend beyond the formal forecast period. Based on these assumptions, free cash flow is projected to reach about $359.0 Million in 2035, supported by a gradual slowdown in growth as the business matures.
When all those future cash flows are discounted back, the intrinsic value is estimated at around $141.45 per share. Compared with the current share price, this suggests that HNI trades at about a 70.6% discount, indicating that the market is pricing in a much weaker future than the cash flow outlook used in this model.
Result: UNDERVALUED
Our Discounted Cash Flow (DCF) analysis suggests HNI is undervalued by 70.6%. Track this in your watchlist or portfolio, or discover 913 more undervalued stocks based on cash flows.
Approach 2: HNI Price vs Earnings
For profitable companies like HNI, the price to earnings (PE) ratio is a straightforward way to gauge whether investors are paying a sensible price for each dollar of current earnings. In general, faster growing, lower risk businesses are often associated with higher PEs, while slower growth or higher uncertainty is often associated with lower, more conservative multiples.
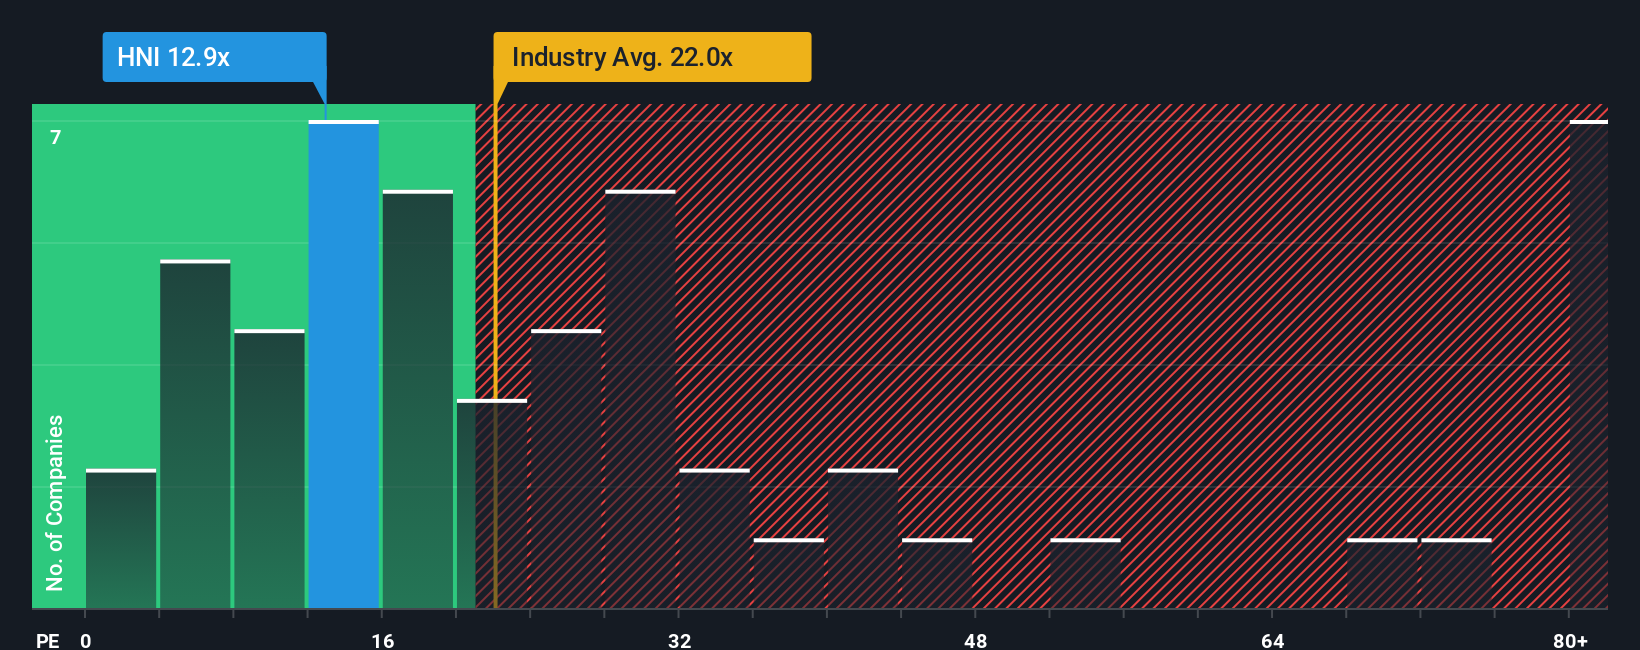
HNI currently trades on a PE of about 13.4x, which is meaningfully below the Commercial Services industry average of roughly 24.9x and also under the peer group average of around 16.8x. On the surface, that discount suggests the market is more cautious about HNI than it is about many of its competitors.
Simply Wall St also calculates a Fair Ratio for each stock, which is the PE you might expect once you factor in its earnings growth profile, profitability, industry, market cap and specific risks. For HNI, that Fair Ratio is estimated at about 23.7x, compared with the current 13.4x. Because this measure is tailored to the company rather than just a blunt comparison with peers, it provides a more nuanced view and indicates that the shares may be undervalued on an earnings basis.
Result: UNDERVALUED
PE ratios tell one story, but what if the real opportunity lies elsewhere? Discover 1455 companies where insiders are betting big on explosive growth.
Upgrade Your Decision Making: Choose your HNI Narrative
Earlier we mentioned that there is an even better way to understand valuation, so let's introduce you to Narratives, a simple way to connect your view of HNI's story with a concrete set of forecasts and a fair value estimate. A Narrative on Simply Wall St lets you spell out how you think HNI's revenue, earnings and margins will evolve, then turns that story into a financial model and a fair value you can compare with today's share price to guide buy or sell decisions. Narratives live inside the Community page on the platform used by millions of investors, and they update dynamically as new information like earnings results, industry news or macro data comes in, so your fair value stays in sync with reality. For HNI, one investor might build a bullish Narrative around continued efficiency gains, wellness-focused products and a fair value near 73 dollars, while another might create a more cautious Narrative focused on hybrid work risks and housing headwinds, landing closer to 60 dollars, and the platform makes it easy to see which story you find more convincing.
Do you think there's more to the story for HNI? Head over to our Community to see what others are saying!

This article by Simply Wall St is general in nature. We provide commentary based on historical data and analyst forecasts only using an unbiased methodology and our articles are not intended to be financial advice. It does not constitute a recommendation to buy or sell any stock, and does not take account of your objectives, or your financial situation. We aim to bring you long-term focused analysis driven by fundamental data. Note that our analysis may not factor in the latest price-sensitive company announcements or qualitative material. Simply Wall St has no position in any stocks mentioned.
Have feedback on this article? Concerned about the content? Get in touch with us directly. Alternatively, email editorial-team@simplywallst.com