
- PREMIUM
- LIVE QUOTES
- INSTITUTIONS
 Index Options
 State Street
 CME Group
 Nasdaq
 Cboe
Cboe TradingView
 Wall Street Journal
Is It Too Late to Consider Hilton After Its Strong 2025 Share Price Rally?
- Wondering if Hilton Worldwide Holdings is still a smart buy after its huge run, or if the easy money has already been made? You are not alone.
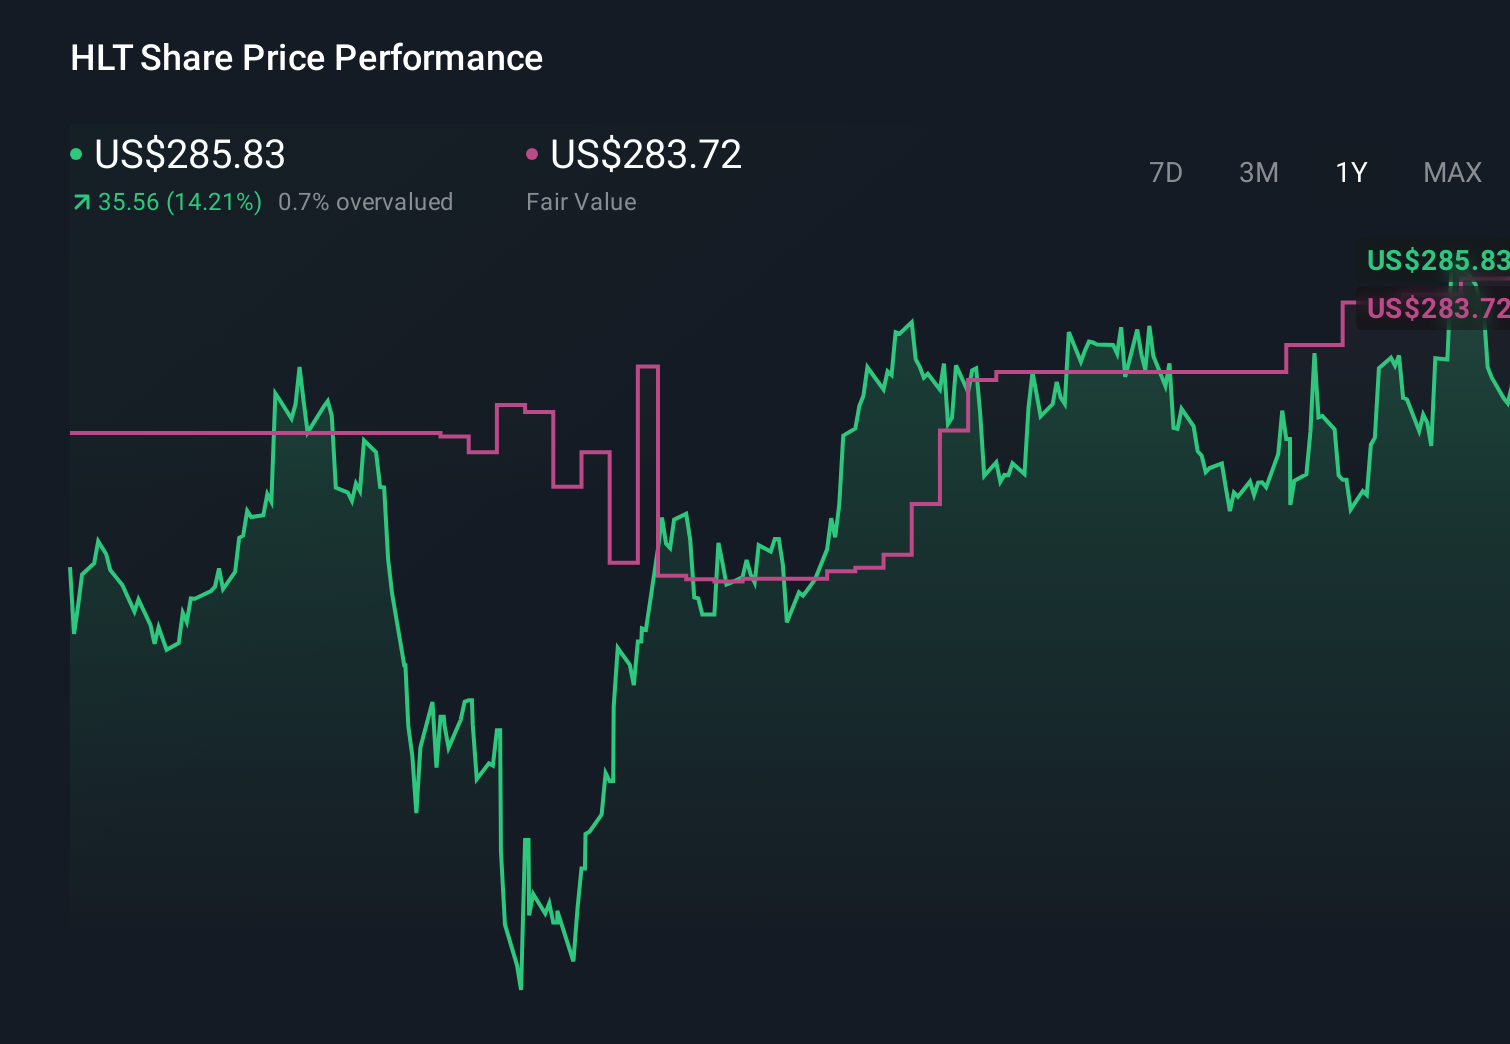
- The stock has climbed 5.9% over the last week, 6.0% over the past month and is now up 16.6% year to date, adding to an already impressive 178.3% gain over five years.
- Part of this strength reflects steady optimism around global travel demand and Hilton's capital-light, fee-based model that investors increasingly see as structurally attractive. At the same time, headlines about expanding branded properties, loyalty program momentum and continued share repurchases have kept Hilton in the conversation as a quality compounder rather than a cyclical rebound play.
- Despite that backdrop, Hilton currently scores just 0/6 on our valuation checks, which raises fair questions about how much future growth is already priced in. In the next sections we will walk through different valuation approaches to see what the numbers really say. We will then finish with a more nuanced way to think about Hilton's worth beyond any single model.
Hilton Worldwide Holdings scores just 0/6 on our valuation checks. See what other red flags we found in the full valuation breakdown.
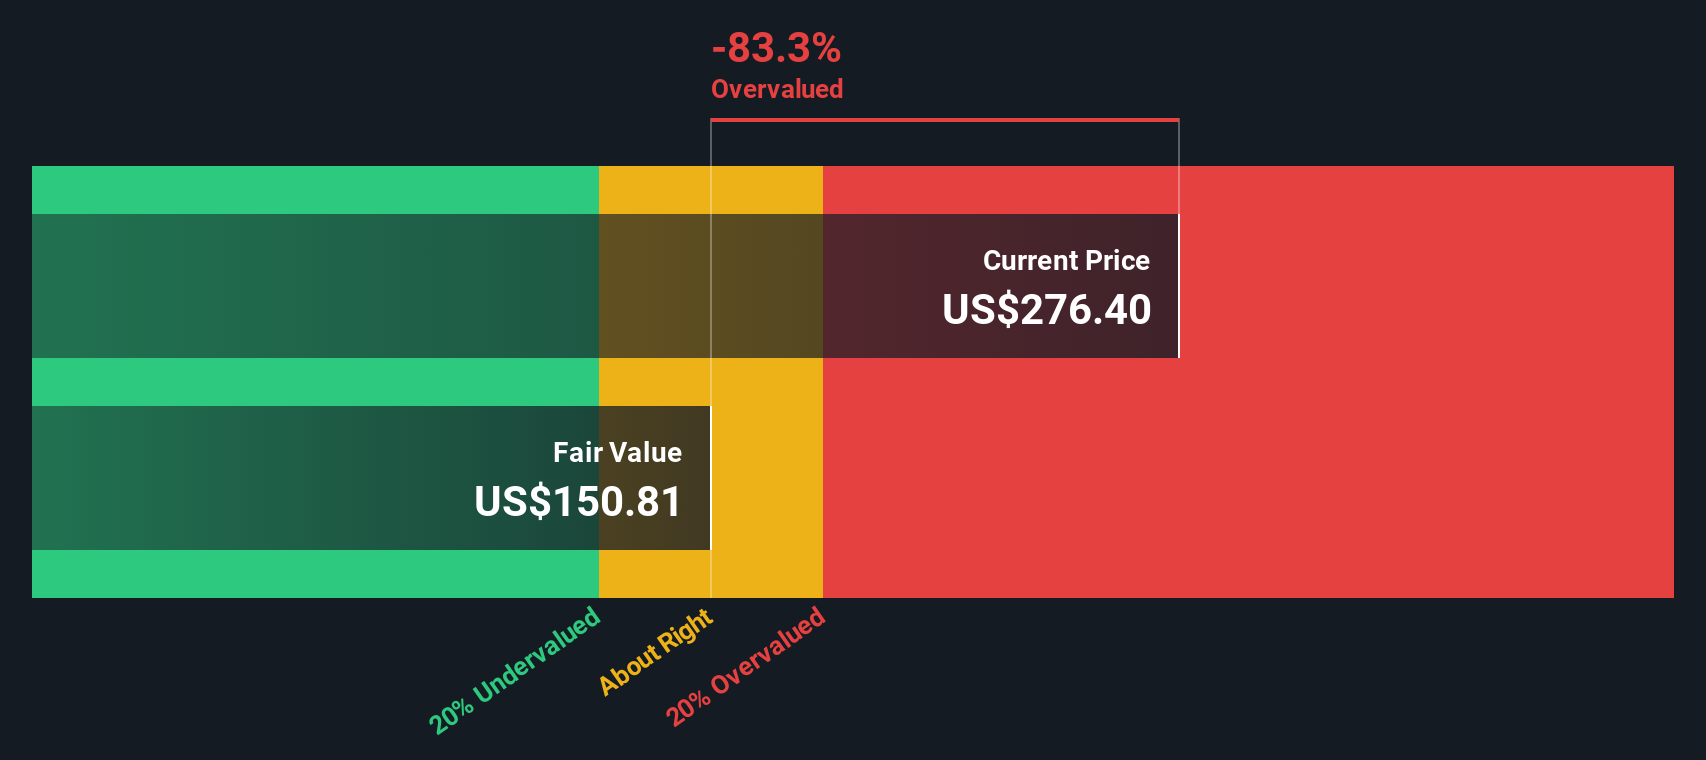
Approach 1: Hilton Worldwide Holdings Discounted Cash Flow (DCF) Analysis
A Discounted Cash Flow model estimates what a company is worth by projecting its future cash flows and discounting them back to today in dollar terms. For Hilton Worldwide Holdings, the model starts with last twelve months Free Cash Flow of about $2.29 billion and uses analyst forecasts for the next few years, then extrapolates further out as growth gradually slows.
Simply Wall St applies a 2 Stage Free Cash Flow to Equity approach, projecting FCF to reach roughly $2.83 billion by 2035 as the business expands. These future cash flows are then discounted to reflect risk and the time value of money, giving an estimated intrinsic value of around $165.75 per share.
Compared with the current market price, this model output indicates the stock is roughly 72.5% overvalued. This suggests that investors are paying a substantial premium to the modelled cash flow outlook and may have limited margin of safety if growth is weaker than expected.
Result: OVERVALUED
Our Discounted Cash Flow (DCF) analysis suggests Hilton Worldwide Holdings may be overvalued by 72.5%. Discover 913 undervalued stocks or create your own screener to find better value opportunities.
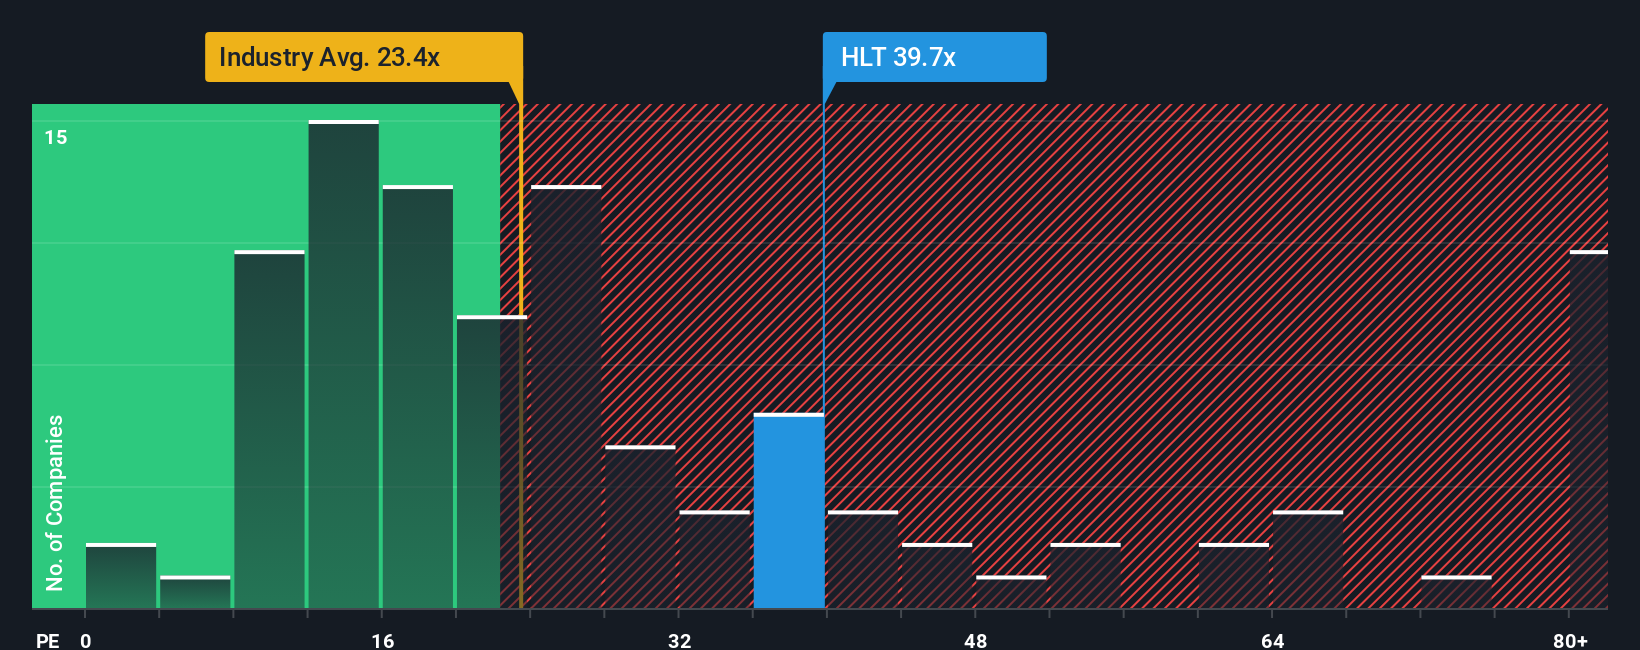
Approach 2: Hilton Worldwide Holdings Price vs Earnings
For profitable, mature businesses like Hilton, the Price to Earnings ratio is a practical yardstick because it directly links what investors pay for each share to the earnings that the business is currently generating. In general, faster growth and lower perceived risk justify a higher normal PE ratio, while slower growth or higher risk usually demand a discount.
Hilton currently trades on about 39.90x earnings, which is well above both the Hospitality industry average of roughly 23.12x and the peer average of around 26.59x. On the surface, that premium suggests investors are pricing in stronger growth or greater resilience than the typical hotel operator.
Simply Wall St also calculates a Fair Ratio of about 29.74x, a proprietary view of what Hilton’s PE should be once its earnings growth profile, profit margins, risk factors, industry context and market cap are all taken into account. This makes it more tailored than blunt comparisons with peers or the sector, which can miss important company specific strengths or vulnerabilities. Set against this customised benchmark, Hilton’s current 39.90x PE looks rich, implying the shares trade meaningfully above what these fundamentals alone would warrant.
Result: OVERVALUED
PE ratios tell one story, but what if the real opportunity lies elsewhere? Discover 1455 companies where insiders are betting big on explosive growth.
Upgrade Your Decision Making: Choose your Hilton Worldwide Holdings Narrative
Earlier we mentioned that there is an even better way to understand valuation. On Simply Wall St this takes the form of Narratives, which are easy to use, story driven forecasts that let you spell out your view of Hilton’s future revenue, earnings and margins. You can link that story to a financial model and fair value estimate, and then compare that fair value with today’s price to decide whether to buy, hold or sell. This all takes place in a dynamic framework on the Community page that automatically refreshes when new earnings, news or guidance arrives. For example, one Hilton Narrative might lean into aggressive Asia Pacific luxury expansion, resilient loyalty driven margins and a fair value closer to the most bullish target of about $311. Another more cautious Narrative might focus on softer RevPAR, macro headwinds and execution risks and arrive nearer the most bearish target of about $229. This helps you see not just what other investors think Hilton is worth, but exactly why they think that way and where your own view fits along that spectrum.
Do you think there's more to the story for Hilton Worldwide Holdings? Head over to our Community to see what others are saying!
This article by Simply Wall St is general in nature. We provide commentary based on historical data and analyst forecasts only using an unbiased methodology and our articles are not intended to be financial advice. It does not constitute a recommendation to buy or sell any stock, and does not take account of your objectives, or your financial situation. We aim to bring you long-term focused analysis driven by fundamental data. Note that our analysis may not factor in the latest price-sensitive company announcements or qualitative material. Simply Wall St has no position in any stocks mentioned.
Have feedback on this article? Concerned about the content? Get in touch with us directly. Alternatively, email editorial-team@simplywallst.com